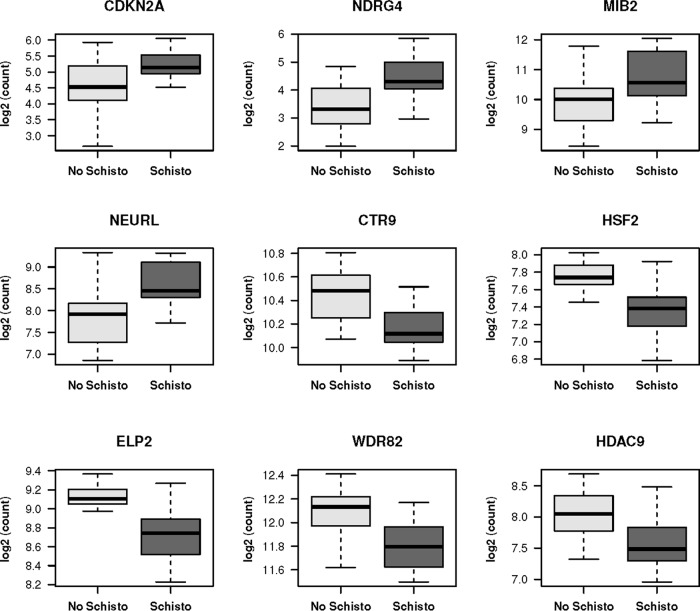
FIG 4.
Differences in transcript counts in peripheral blood for nine representative genes found to be significantly differentially expressed in S. haematobium infection. The plots include median (dark horizontal line) and interquartile range (box), with error bars representing 1.5 times the interquartile range or the minimum/maximum value. The P value for differences was <0.05 after adjustment for multiple comparisons for all genes shown.

