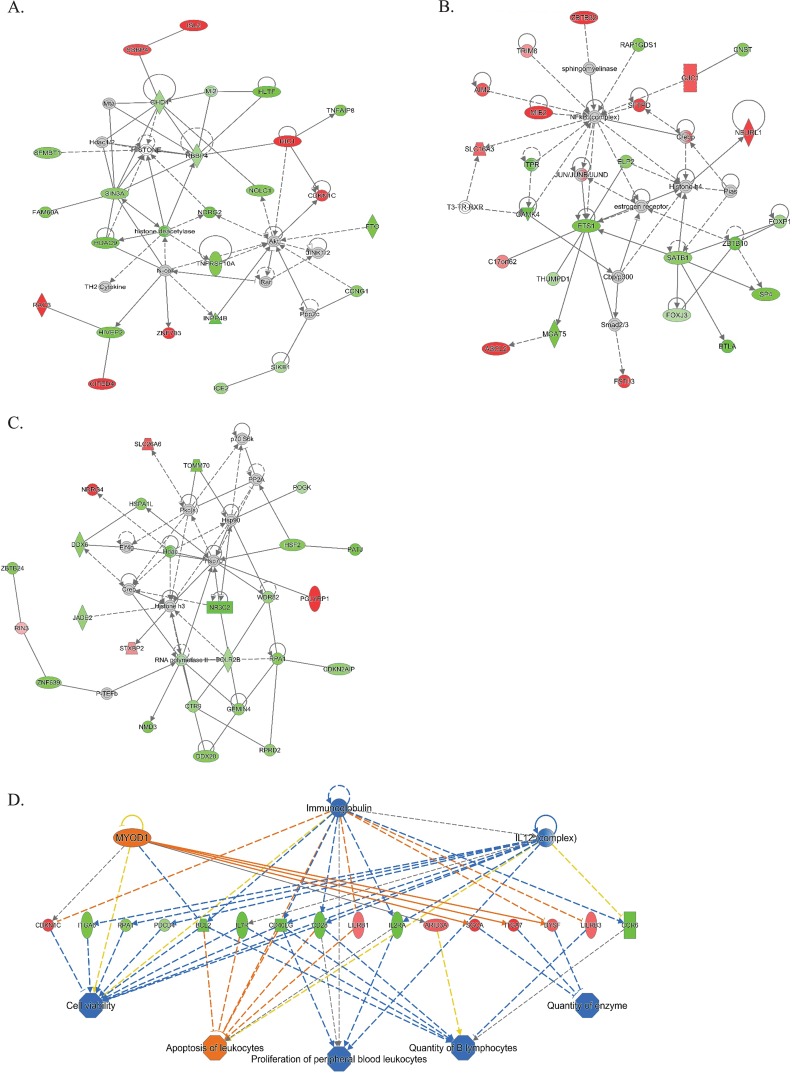
FIG 5.
(A to C) Top networks identified by IPA as differentially regulated in individuals with versus without schistosome infection, adjusting for sex as a covariate. The top networks were identified by IPA as being differentially affected in the setting of S. haematobium infection. Green indicates genes that have decreased expression in people with S. haematobium, and red indicates increased expression. Higher-intensity red or green indicates a greater magnitude fold change in expression. Solid lines represent direct interactions, and dotted lines represent indirect interactions. Gray indicates that a relationship is not predicted. (D) Top regulator effect network for the gene expression changes. Yellow indicates that findings are inconsistent. Orange indicates the predicted activation, while blue indicates the predicted inhibition, with intensity of color reflecting increased or decreased confidence in the prediction.

