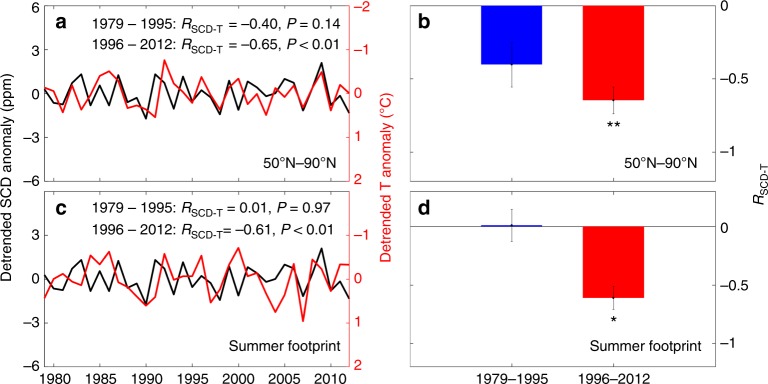
Fig. 1.
Negative temperature control of summer CO2 drawdown. a–d Time series of anomalies of summer CO2 drawdown (SCD, black line) and summer temperature (T, red line) calculated as the average for July and August across ecosystems north of 50°N (a), the spatial average weighted by the potential emission sensitivities from FLEXPART over the vegetated land area within the multi-year mean summer footprint (c), The comparison of interannual partial-correlation coefficient between SCD and T (RSCD-T) between the two periods (1979–1995 and 1996–2012) based on north of 50°N and summer footprint, respectively b and d. The interannual partial-correlation coefficient is calculated by statistically controlling for the effects of summer precipitation and cloudiness. We calculate RSCD-T through randomly selecting 14 of the 17 years in each corresponding period, and then take their standard deviation as the error bar. All variables were detrended for each period before the partial-correlation analysis. * and ** indicate that the partial-correlation coefficient is significant at P < 0.05 and P < 0.01, respectively. The figure was created using Matlab R2016a

