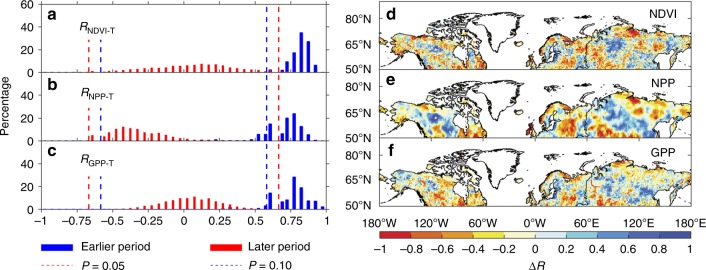
Fig. 2.
Link between summer vegetation activities and summer temperature. a–c Frequency distributions of the partial-correlation coefficient of summer NDVI (RNDVI-T) (a), satellite-derived net primary productivity (RNPP-T) (b) and gross primary productivity based on flux-tower data (RGPP-T) (c) with summer temperature (T) during the earlier and later periods. Significant partial-correlation coefficients (based on a sample size of 11) are identified as dashed lines (magenta, P < 0.05; blue, P < 0.1). All variables were detrended for each period before the partial-correlation analysis. d–f Spatial distribution of differences of RNDVI-T, RNPP-T, and RGPP-T between the earlier and later periods. The earlier period is 1982–1995, and the later periods are 1996–2012 for NDVI, 1996–2011 for NPP and 1996–2011 for GPP. The figure was created using Matlab R2016a

