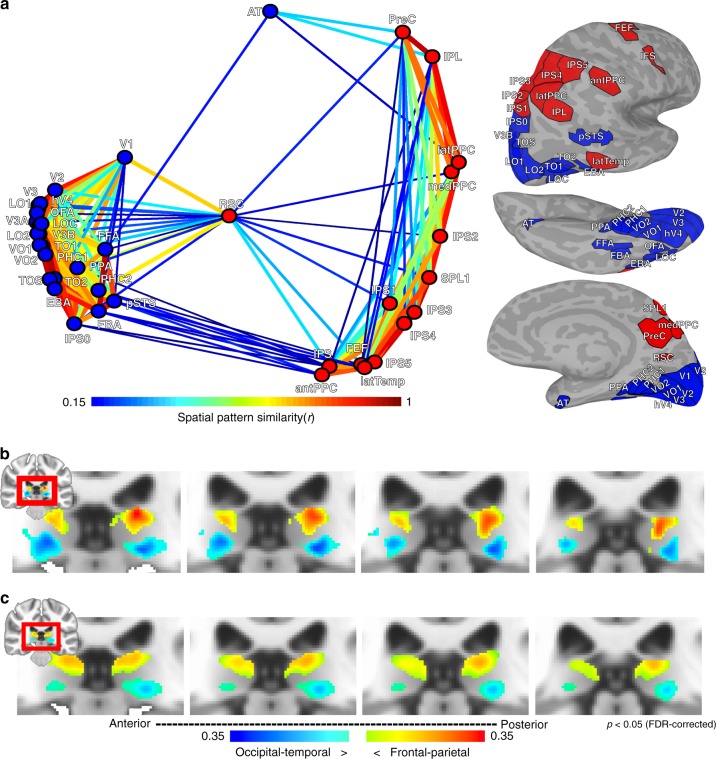
Fig. 2.
Organization of pulvino-cortical functional coupling. a 2D plot of multidimensional scaling on the group average (n = 13) pattern similarity of pulvino-cortical functional coupling between 39 cortical areas. Only ipsilateral correlations were considered. Data clustering yielded 2 groups. One cluster (blue) mainly contained occipital and temporal cortical areas associated with the ventral visual stream. The other cluster (red) mainly contained frontal and parietal cortical areas associated with the dorsal visual stream. Line thickness and color coding reflects similarity strength between areas. Surface figures illustrate all cortical areas tested; fill color matched to assigned cluster. b The difference between the two cluster’s pulvino-cortical connectivity maps segmented the pulvinar into dorsal and ventral sections. Colors correspond to the blue and red clusters shown in (a), threshold at an p < 0.05 FDR-corrected. c Same analysis as in (b), but from calculating pulvino-cortical connectivity maps using the Human Connectome Project’s 180 cortical areas as the cortical correlation profile

