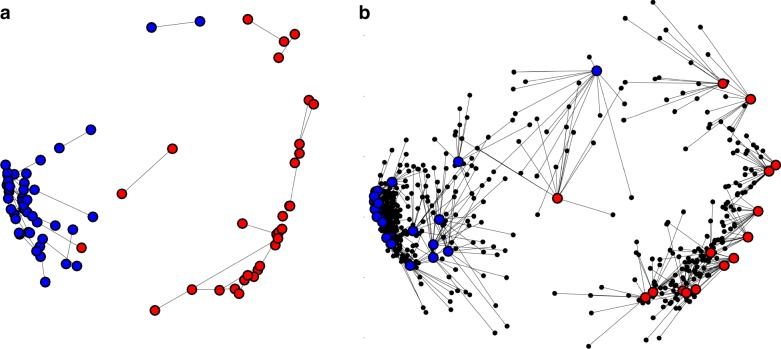
Fig. 3.
Consistency of pulvino-cortical coupling between hemispheres and across individuals. a Multidimensional scaling for left and right hemisphere pulvino-cortical functional connectivity. Procrustes analysis was performed to align MDS of the left hemisphere to the right hemisphere. Lines illustrate the distances between areas matched between hemispheres. Dots were color-coded based on clustering performed on each hemisphere separately. The only difference in clustering between hemispheres was area pSTS (i.e., the only blue and red dots linked by a line). b MDS for each subject’s pulvinar connectivity (averaged across hemisphere). Procrustes analysis was performed to align MDS of each subject to the group average. Small black dots illustrate the locations of individual subject areas. Lines illustrate distances of between individual subjects and the group average for matched areas. Dots were color-coded based on clustering performed on the group average

