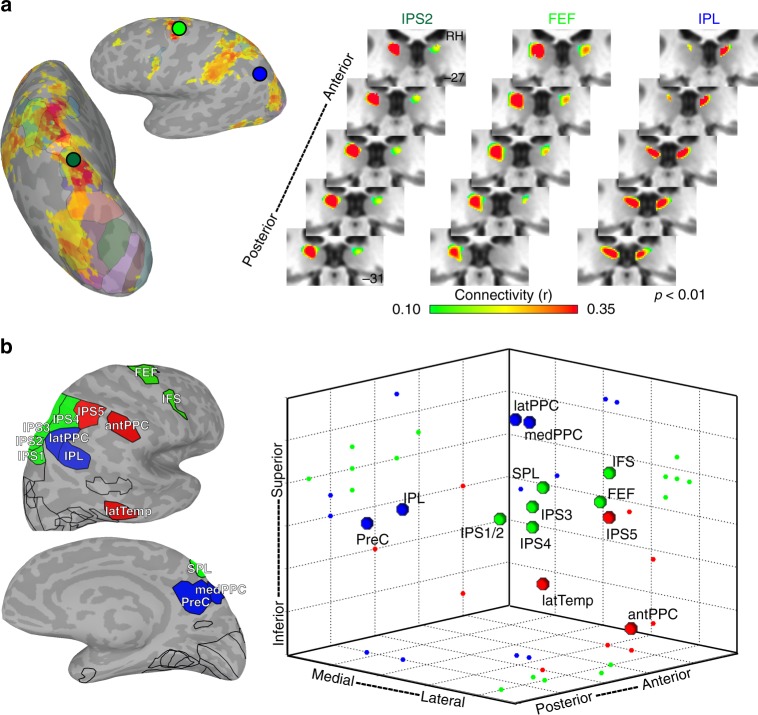
Fig. 5.
Functional coupling with dorsal pulvinar. a Group average (n = 13; p < 0.01 from one-sample t test across subjects) correlations within the dorsal pulvinar for three cortical seed areas (IPS2 (dark green), FEF (light green), and IPL (blue)). Surface figures illustrate the cortical correlation patterns from seed in IPS2 in a single subject. Circle colors correspond to area labels for functional coupling with dorsal pulvinar. b Three-dimensional plot of cortical connectivity map peaks in the dorsal pulvinar. Peak coordinates from the left hemisphere were reflected across the midline and averaged with the right hemisphere. Spheres depict the 3D spatial location of each area’s peak connectivity within the dorsal pulvinar. 2D projections of each data point are plotted on the walls and floor of the graph. Pulvino-cortical connectivity within the dorsal pulvinar was clustered into three groups. Within the largest cluster (green) containing the IPS1-4, FEF, and IFS, connectivity reflected cortical distance with IPS1/2 located most posteriorly, followed by IPS3/4 and then FEF and IFS located anterior. The peak connectivity for SPL, which is located medial to the IPS maps cortically, was located medial to the IPS1-4 peak correlations in the pulvinar. A second cluster (red) contained tool-selective regions in anterior parietal and lateral temporal cortex as well as IPS5. The third cluster (blue) contained medial, lateral, and inferior parietal areas as well as the precuneus. Surface figures illustrate the outlines of all cortical areas tested and color filled areas correspond to those included in the clustering of the dorsal pulvinar

