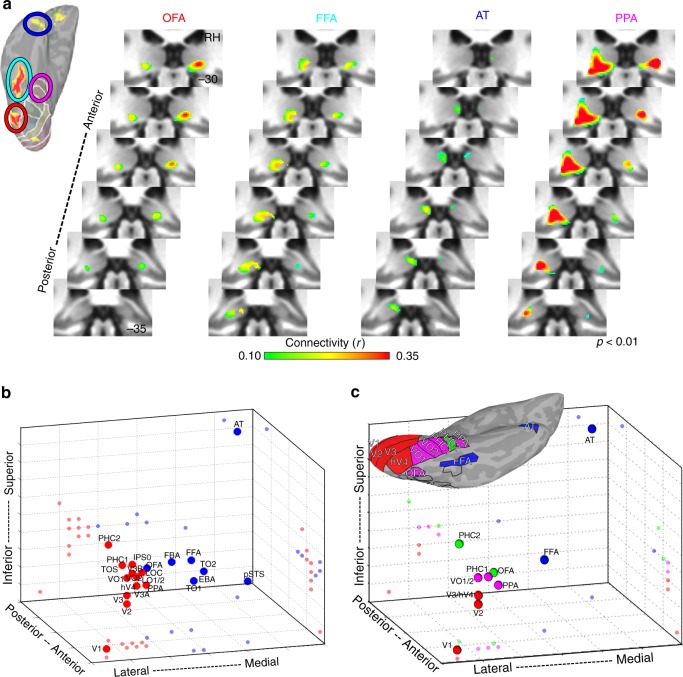
Fig. 6.
Functional coupling with ventral pulvinar. a Group average correlation maps (n = 13; p < 0.01 from one-sample t-test across subjects) are shown for four cortical areas defined based on their functional specialization: occipital face area (orange), fusiform face area (cyan), anterior temporal face area (blue), and parahippocampal place area (magenta). Correlations were strongest within the ventral and posterior-most portions of the pulvinar for each area. Surface figure illustrates the localization of face- and scene-selective regions in an individual subject. Circle color code matches area labels on right. Each cortical region showed greater activity for face vs. scene stimuli (p < .01, FDR-corrected). b Three-dimensional plot of the peak occipital and temporal pulvino-cortical connectivity within the ventral pulvinar. Spheres depict the 3D spatial location of each area’s peak connectivity within the ventral pulvinar. 2D projections of each data point are plotted on the walls and floor of the graph. Clustering revealed 2 groups that differentiated lateral (red) and medial (blue) portions of the ventral pulvinar. c Same plot as in (b), but for a subset of ventral areas. Clustering of connectivity within the ventral pulvinar revealed 4 groups

