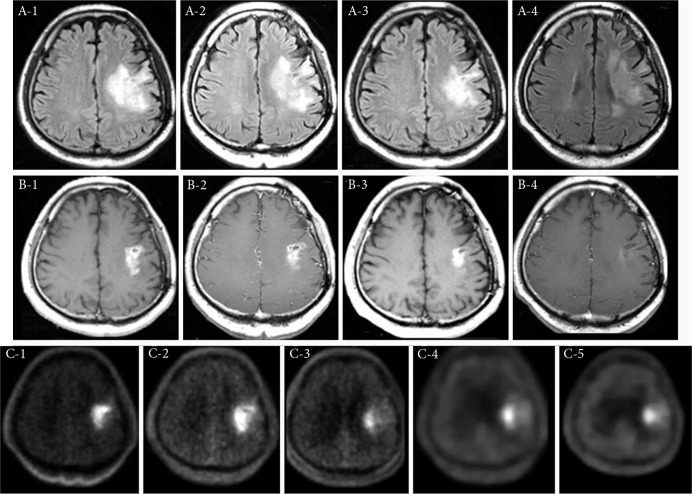
Fig. 2.
Periodic change of MRI in Case 7. The upper panel (A-1 to A-4) shows FLAIR MRI studies. The middle panel (B-1 to B-4) shows Gd-T1 MRI studies. The lower panel (C-1 to C-5) shows time course of BPA–PET imaging. A-1 and B-1 are prior to BNCT. A-2 and B-2 are 1 week after BNCT. A-3 and B-3 are 1 month after BNCT. A-4 and B-4 are 24 months after BNCT. Each time of point and L/N ratio of PET imaging are stated in case presentation in the text of Results. This is the illustrative case that BNCT can control tumor activity, while BV can control BRN successively and successfully for long time.

