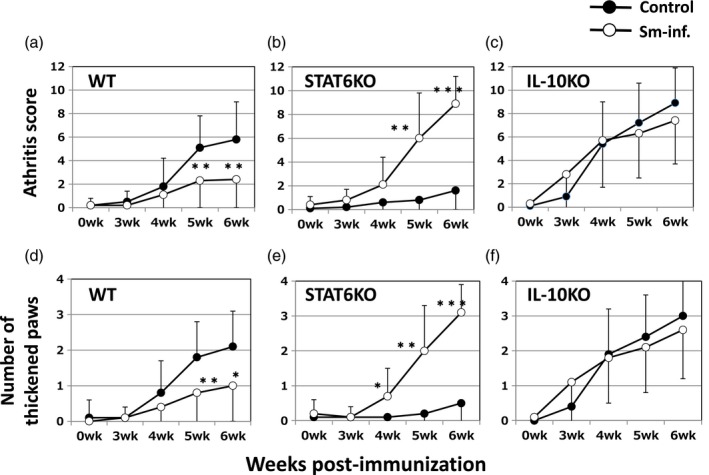
Figure 2.

Effects of Schistosoma mansoni (Sm) on edematous changes in CIA differ among WT (a,d), STAT6 KO (b,e) and IL‐10 KO (c,f) mice. The open and closed circles represent IIC immunized mice with and without Sm infection, respectively. Mice were infected with Sm 3 weeks prior to IIC‐immunization. Data are expressed as the mean ± standard deviation (s.d.) of total arthritis scores for four limbs (a–c) or total numbers of arthritic paws for each mouse (d–f). The values for control mice (closed circles) are the same as those in Fig. 1. *P < 0·05 and **P < 0·01, respectively (Mann–Whitney U‐test). The combined results of four independent experiments are shown.
