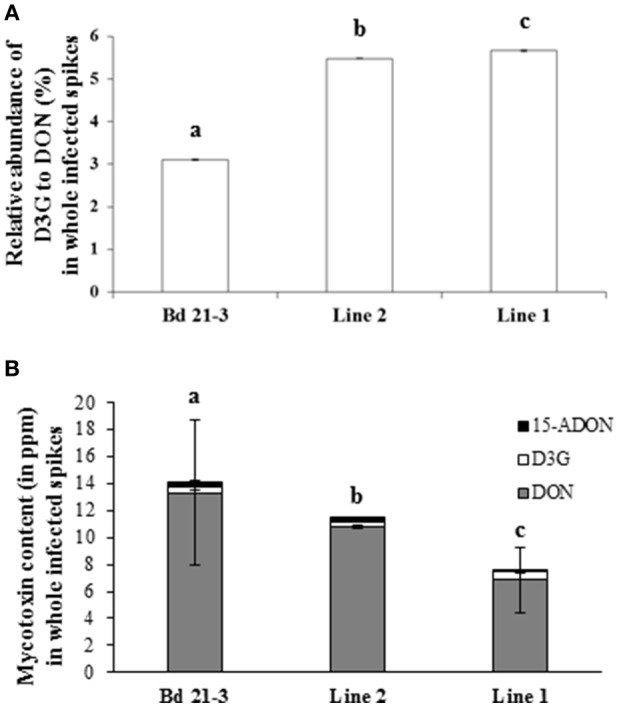
Figure 7.

The wheat UGT encoded by the Traes_2BS_14CA35D5D gene glucosylates DON in planta. (A) Relative abundance of D3G to DON in whole spikes 14 days after inoculation (dai). (B) DON (gray bars), D3G (white bars), and 15-ADON (black bars) absolute quantification in whole spikes 14 dai. Data represent mean values of the independent biological replicates, error bars represent the standard deviation (different letters indicate significant differences between conditions: One way ANOVA and Duncan multiple range test (α = 0.01).
