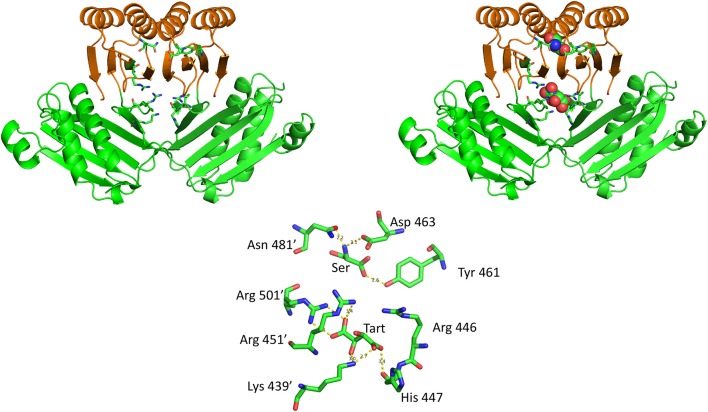
Figure 10.
The relationship of the ACT (orange) and ASB (green) domains in M. tuberculosis PGDH. The depiction on the left shows the domains in the absence of bound ligands and the depiction on the right shows L-serine and tartrate bound at their respective sites. The stick model at the bottom shows the specific residue interactions seen in the crystal structure.

