
Figure 1.
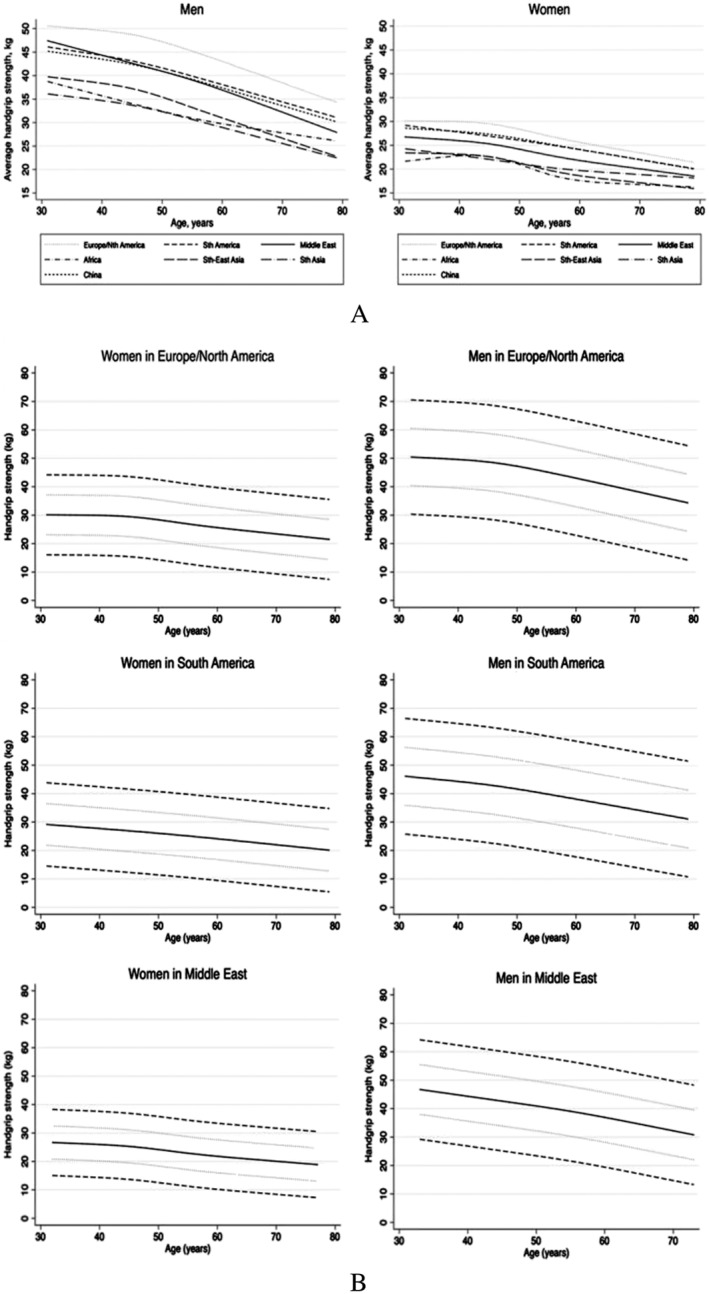
(A) Average handgrip strength as a function of age. Nth, North; Sth, South. Reproduced with permission from Leong et al.54 (B) Estimated handgrip strength (solid line) as a function of age. The dotted curves represent ±1 SD, and the dashed curves represent ±2 SD. Reproduced with permission from Leong et al.54