
Figure 2.
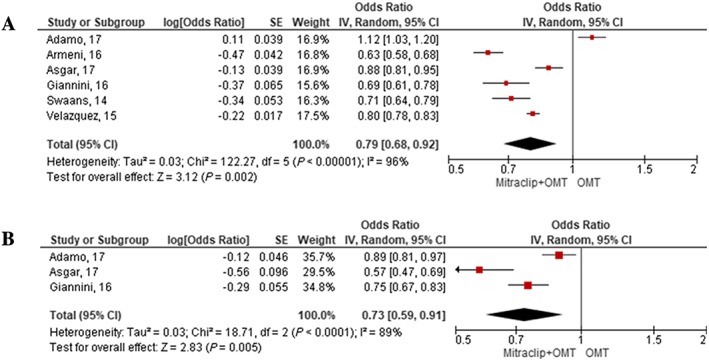
Random‐effects meta‐analysis of percutaneous mitral valve repair vs. conservative therapy for study‐level analysis. Forest plot showing the result of meta‐analysis of percutaneous mitral valve repair vs. conservative therapy for the primary outcome of death from any causes (A) and for the secondary outcome of re‐hospitalization (B) after a median follow‐up of 400 days (376 to 480). The estimate of the odds ratio (OR) of each study corresponds to the middle of the squares, and the horizontal line shows the 95% confidence interval (CI). For each subgroup, the sum of the statistics, along with the summary OR, is represented by the middle of the solid diamonds. A test of heterogeneity between the trials within a subgroup is given below the summary statistics. OMT, optimal medical therapy; IV, instrumental variable estimation; SE, standard error.