Figure 1.

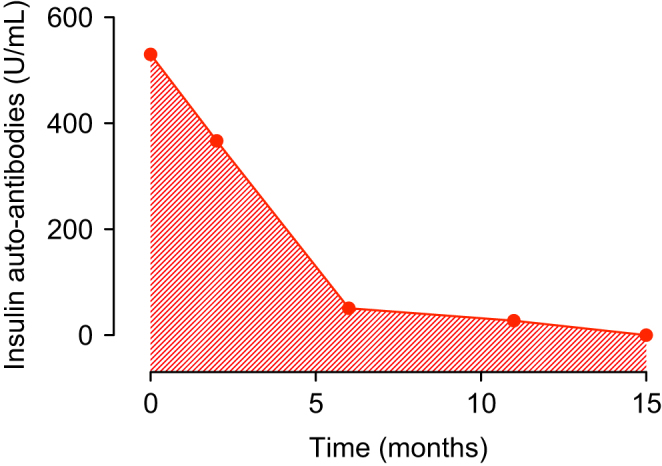
Insulin autoantibodies (IAA) concentrations during the follow-up. On the X axis time is represented in months from the first report of IAA.

Insulin autoantibodies (IAA) concentrations during the follow-up. On the X axis time is represented in months from the first report of IAA.