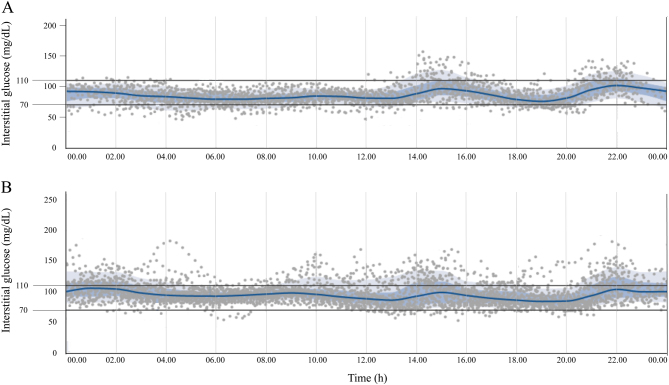
Figure 2.
Interstitial glucose concentrations measured with flash glucose monitoring (FGM) system. Panel A: interstitial glucose concentrations during the first month after discharge. Panel B: interstitial glucose concentrations in the sixth month after discharge. Both graphs are modified from the original graphic reports obtained from the FGM system itself. In both panels the grey spots represent single glucose measurements; blue lines represent the mean interstitial glucose concentration; blue-shaded areas represent the interquartile range (25th to 75th percentile); pale-grey areas represent the range from the 10th to the 90th percentile.

 This work is licensed under a