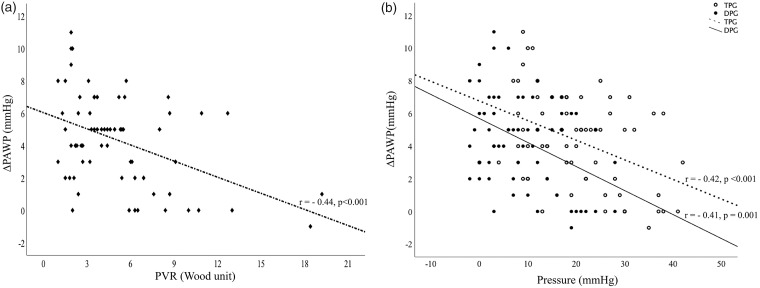
Fig. 2.
Relationship between (a) ΔPAWP* and PVR and (b) ΔPAWP and TPG (empty circles) and DPG (bold circles). A line of best fit was drawn as a linear correlation between ΔPAWP and DPG (solid line), TPG (dashed line), and PVR. Pearson correlation coefficient (r) revealed a moderate inverse relationship between ΔPAWP and both TPG/DPG and PVR. *ΔPAWP = (PAWPpost-fluid – PAWPpre-fluid).

