
Fig. 1.
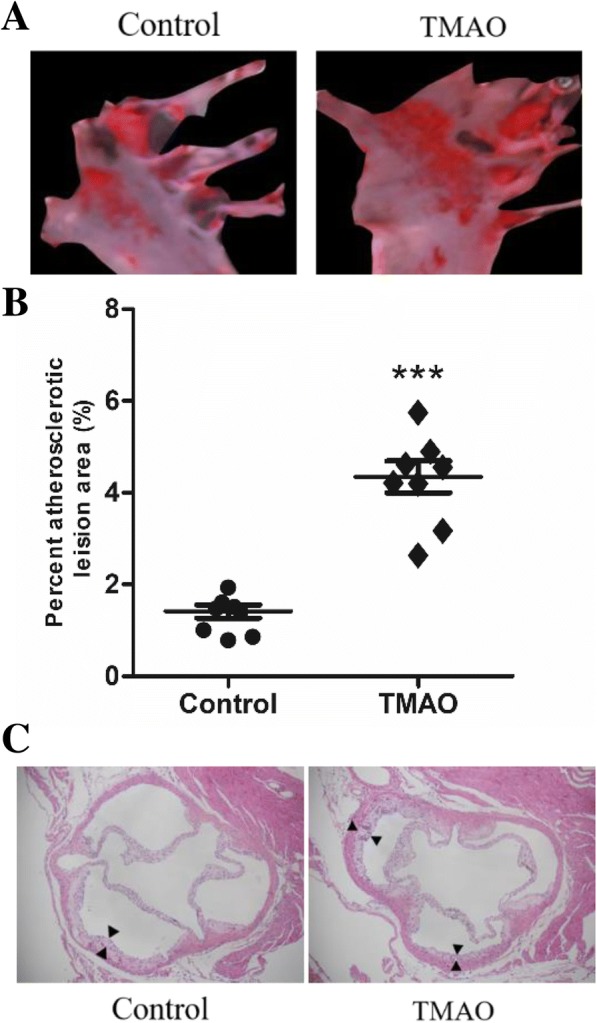
TMAO induced plaque progression in apoE−/− mice (n = 8). a Atheromatous plaques in the aortas were visualized by oil red O (b) Atherosclerotic plaque area relative to total arterial wall area. c Representative photomicrographs of Hematoxylin & eosin (H&E)-stained, cross-sections of the aortic root showed medial thickness and formation of foam cell in the adventitia (40X magnification). *** p < 0.001 versus Control group