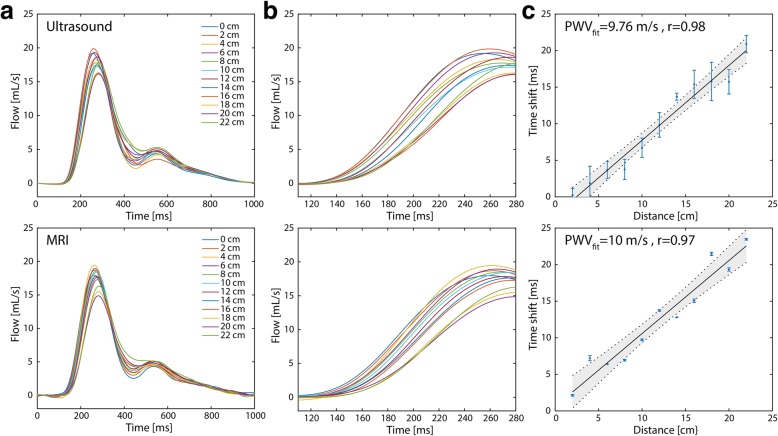
Fig. 7.
Ultrasound- and CMR-based PWV measurements in the flow phantom. a Flow in mL/s measured at 14 positions along the tube (every 2 cm) with the ultrasound probe (top) and with CMR (bottom). b Close-up of the region between 120 and 280 ms for better visibility of the time shifts between the curves. c Transit time versus the distance between the tubes. A linear fit yields the PWV

