Figure 1:
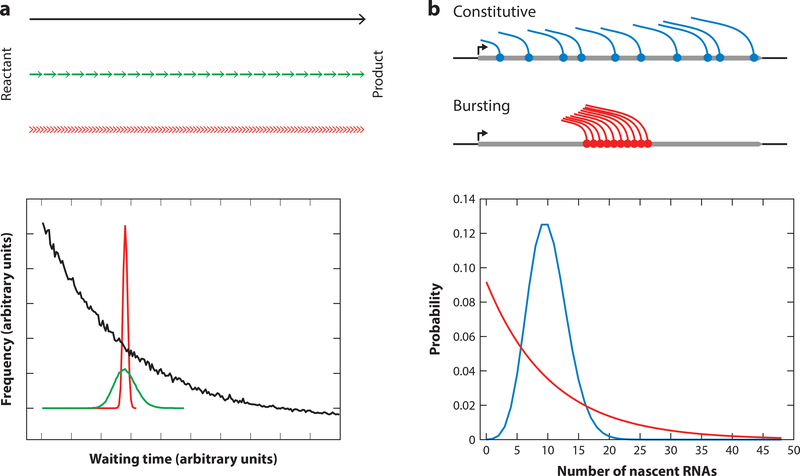
Theoretical concepts in transcription dynamics. (a) The distribution of waiting times between events for three kinetic processes that have the identical net rate going from reactant to product. If the process is a single-step process or has a rate-limiting step, the time between events is exponentially distributed (black line). If the process consists of sequential steps, the distribution is a peaked distribution, which resembles a Gaussian (green line). In the limit of many sequential steps, the time between events is sharply distributed around the mean value (red line). The distributions are from Monte Carlo simulations. Adapted from Reference 73 with permission. (b) Different transcription dynamics result in different distributions of the number of nascent RNAs per cell. For a gene that is transcribed with constitutive initiation, the number of RNAs at the transcription site follows a Poisson distribution (blue). When a gene is transcribed in bursts, the distribution follows a negative binomial distribution (red). In this example, burst size is 10, burst frequency is 1 burst/min, and the dwell time of the transcript at the transcription site is 1 min. The average RNA production of both transcription types in this example is the same.

