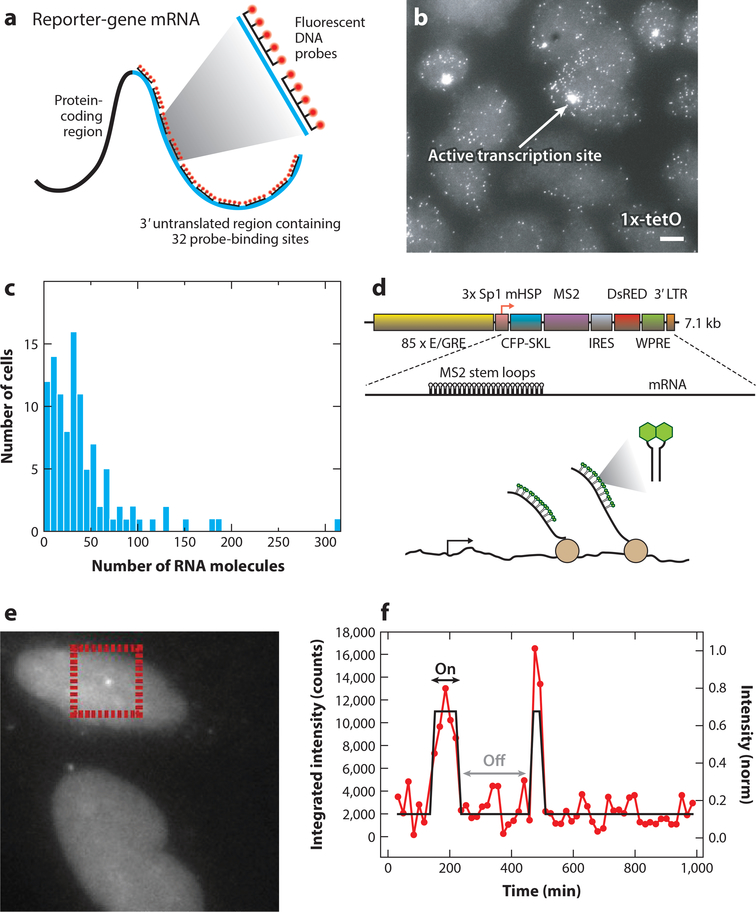
Figure 2:
Measuring polymerase dynamics in fixed and living cells. (a) Schematic of the single-molecule fluorescence in situ hybridization (smFISH) procedure. Fluorescent probes are hybridized along the RNA, resulting in bright fluorescent spots. (b) Example of an smFISH experiment, showing mRNA of a reporter gene driven by a 1x-tetO-containing promoter in Chinese hamster ovary cells. (c) The distribution of the number of mRNAs per cell, obtained from an smFISH experiment. Panels a-c adapted from Reference 108 with permission. (d) Schematic of the reporter gene used to measure RNA in living U2-OS cells. When the MS2 sequences are transcribed, they form stem loops that are bound by fluorescent coat proteins. (e) Example of nascent RNA at an active transcription site of the reporter gene in living cells. (f) Quantification of the transcription site intensity, showing the on and off states of transcription. Panels d-f adapted from Reference 72 with permission. Abbreviations: E/GRE, ecdysone/glucocorticoid response element; Sp1, specificity protein one binding site; mHSP, minimal heat shock promoter; CFP-SKL, cyan fluorescent protein with a C-terminal SKL amino acid peroxisome-targeting motif; IRES, internal ribosome entry site; WPRE, woodchuck hepatitis virus posttranscriptional regulatory element; LTR, long terminal repeat.

