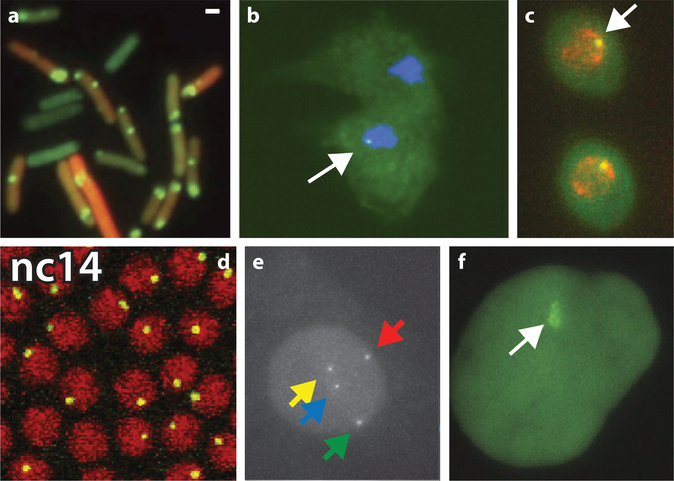
Figure 3:
Visualization of transcription in different organisms. (a) MS2-labeled RNA (green) from a reporter gene, driven by the P-lac/ara promoter. Panel a modified from Reference 48 with permission. (b) MS2-labeled RNA at a developmental gene in Dictyostelium. Panel b modified from Reference 29 with permission. (c) PP7-labeled RNA at the GLT1 gene with the POL1 promoter in Saccharomyces cerevisiae. Panel c modified from Reference 73 with permission. (d) MS2-labeled RNA at a reporter gene driven by the hunchback promoter and enhancer in a developing Drosophila embryo, nuclear cycle 14 (nc14). Panel d modified from Reference 47 with permission. (e) MS2-labeled Actb RNA after 13 min serum stimulation in immortalized mouse embryonic fibroblasts, obtained from an Actb-MBS knock-in mouse (77). (f) MS2-labeled RNA at a reporter gene in U2-OS cells. Panel f modified from Reference 60 with permission. Arrows in panels point to transcription sites.

