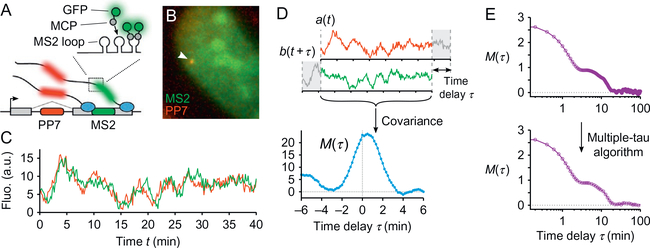
Fig. 1.
Transcriptional time traces and correlation function. (A) The MS2 and PP7 RNA-labeling technique consists in inserting, in one or two gene(s) of interest, two DNA cassettes (MS2 and PP7; here at two different locations in the same gene). They produce stem-loop structures in the nascent RNAs, which are bound by an MS2 or PP7 coat protein (MCP and PCP) fused to a fluorescent protein (eg, GFP and mCherry, respectively). (B) The transcription site (arrow) appears as a bright diffraction-limited spot in the nucleus in both fluorescence channels. (C) Recording its intensity fluctuations then yields a signal that is proportional to the number of nascent RNAs on the gene over time. (D) Using this signal as an example, the computation of a correlation function (here the covariance function) consists in shifting one signal relatively to the other and calculating the covariance between the values of the overlapping portions of the two signals as a function of the time-delay shift (Eqs. 1 and 2). (E) To analyze fluctuations at multiple timescales in a signal, computing the correlation function with the multipletau algorithm yields a somewhat uniform spacing of the time-delay points on a logarithmic scale (simulated data as in Fig. 2A). Panels (B) to (D): Data from Coulon, A., Ferguson, M. L., de Turris, V., Palangat, M., Chow, C. C., & Larson, D. R. (2014). Kinetic competition during the transcription cycle results in stochastic RNA processing. eLife, 3. http://doi.org/10.7554/eLife.03939.

