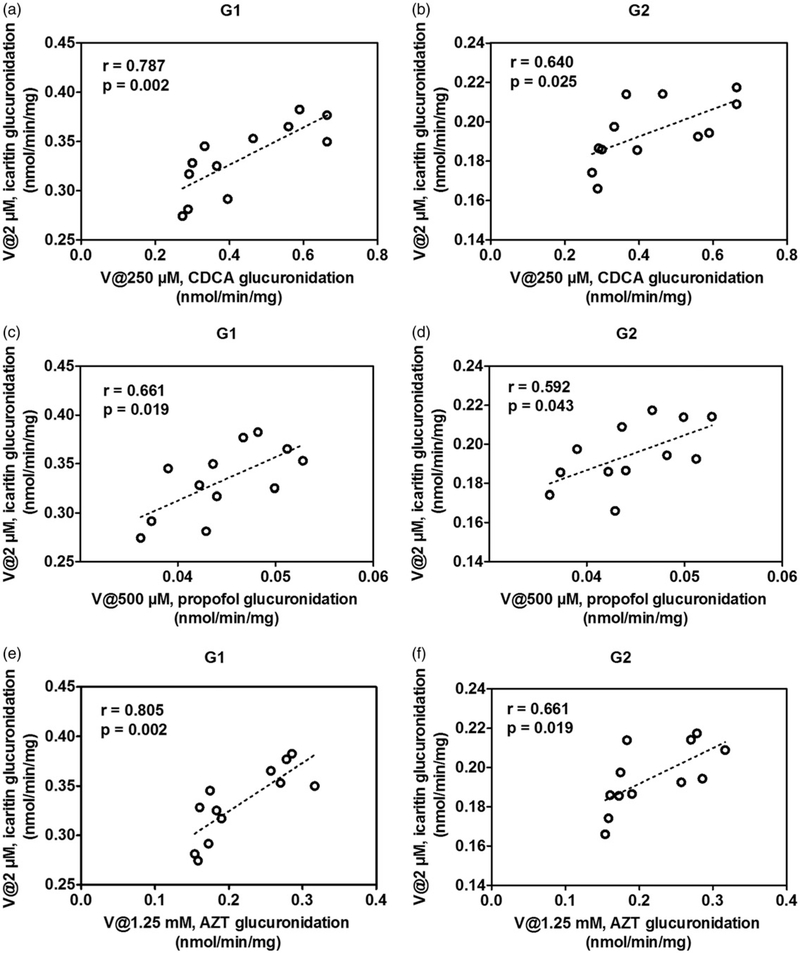
Figure 5.
Correlation analysis between icaritin 3-O-glucuronidation and CDCA glucuronidation (a), icaritin 7-O-glucuronidation and CDCA glucuronidation (b) in a bank of individual human liver microsomes (n=12); Correlation analysis between icaritin 3-O-glucuronidation and propofol glucuronidation (c), icaritin 7-O-glucuronidation and propofol glucuronidation (d) in a bank of individual human liver microsomes (n=12); Correlation analysis between icaritin 3-O-glucuronidation and AZT glucuronidation (e), icaritin 7-O-glucuronidation and AZT glucuronidation (f) in a bank of individual human liver microsomes (n=12). All experiments were performed in triplicate.

