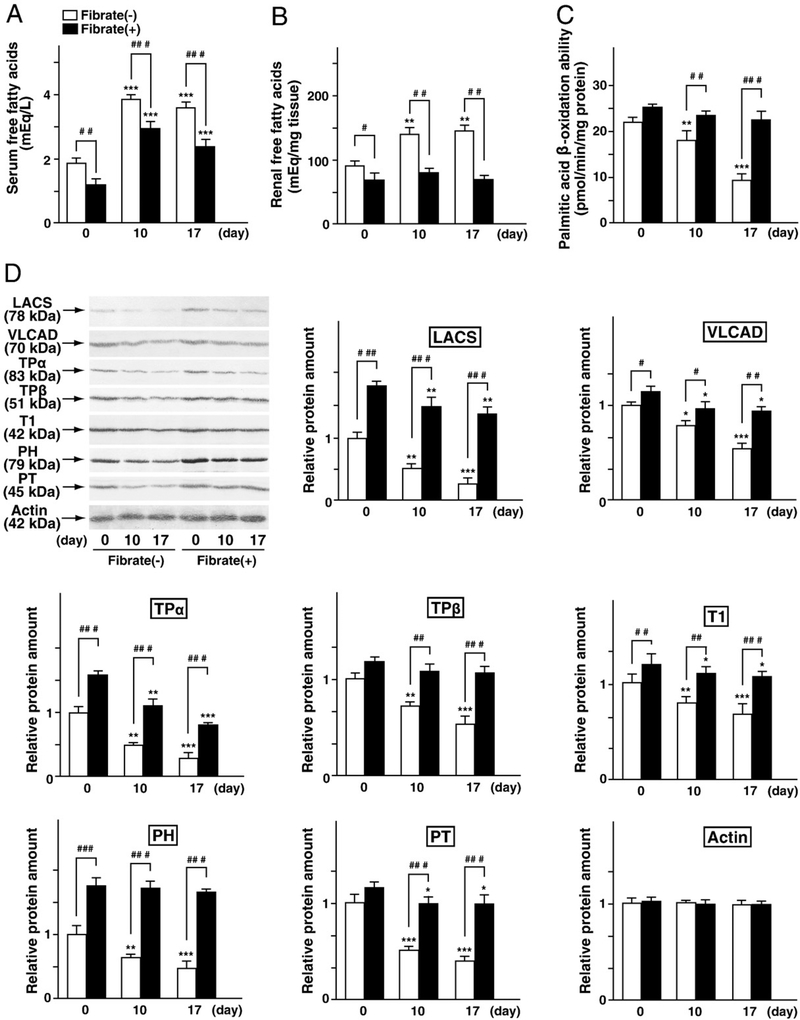
Fig. 3.
Analysis of renal fatty acid metabolism. (A and B) Serum concentration and renal content of FFAs in FFAs-binding BSA-injected mice, respectively. (C) Palmitic acid β-oxidation capacity in the renal cortex. Values are means±SD (n=3 for each group at day 0; n=5 for each group at day 10; n=6 for each group at day 17). (D) Immunoblot analyses of fatty acid-metabolizing enzymes, including LACS, VLCAD, TPα, TPβ, T1, PH, and PT. Renal cortical lysates (20 μg protein) from all kidneys of each group were used. Immunoblots were performed in triplicate. Band intensity was quantified densitometrically, normalized to that of actin, and subsequently expressed as fold changes relative to that of control mice (regular-diet group at day 0).

