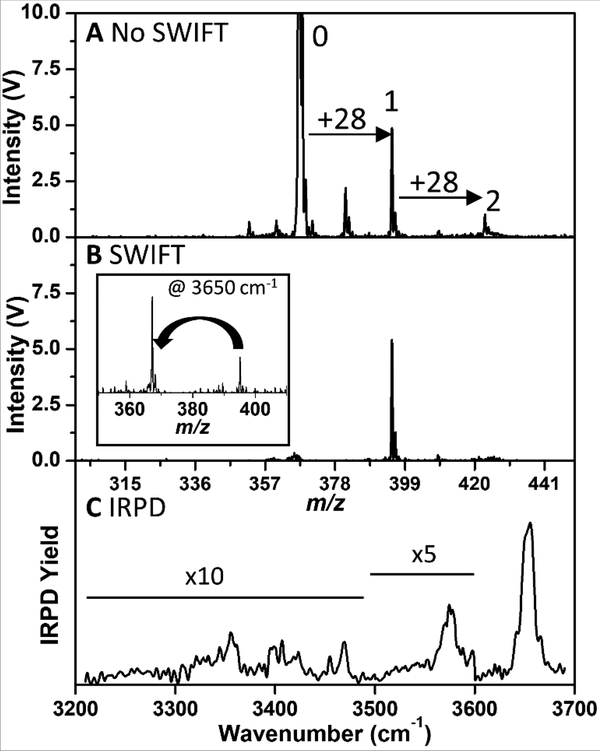
Figure 8.
(A) Mass Spectrum of GYK and its singly (1) and doubly (2) N2-tagged ions. (B) SWIFT-isolated mass spectrum of the singly N2-tagged GYK ion. The inset shows the mass spectrum after the loss of the dinitrogen tag upon absorption of an IR photon at 3650 cm−1. (C) Infrared predissociation spectrum of the singly-tagged GYK ion.

