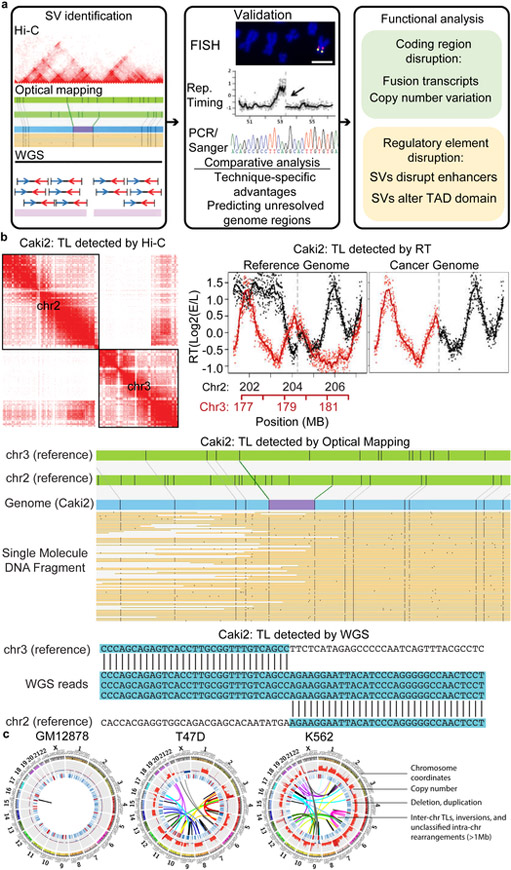
Figure 1 ∣. Overall strategy of SV detection in cancer genomes.
a. The pipeline of SV detection, validation, and functional analysis. b. An example of the same translocations detected by different technologies in Caki2 cells (hg38 coordinates: chr2:204,260,308 and chr3:179,694,900). c. WGS, Hi-C and optical mapping detect SVs at different scales. Hi-C can detect SVs genome-wide at a scale of up to chromosomal size, while optical mapping can detect SVs and build genome maps at ~10kb resolution. Combining Hi-C and optical mapping can resolve complex rearrangements and reconstruct local genome structure. WGS detects SVs at base pair resolution. d. Cancer genomes possess more CNVs and translocations in comparison with karyotypically normal GM12878 cells. Tracks from outer to inner circles are chromosome coordinates, copy number, duplications (red) and deletions (blue), and rearrangements including inversions, inter-chr translocations (TLs) and unclassified rearrangements. Outward red bars in CNV track indicate gain of copies (>2, 2-8 copies), and inward blue loss of copies (<2, 0–2 copies). CNVs are profiled by WGS with 50,000 bp bin size. Duplications, deletion, and TLs are detected by at least two methods from WGS, Irys, and Hi-C.

