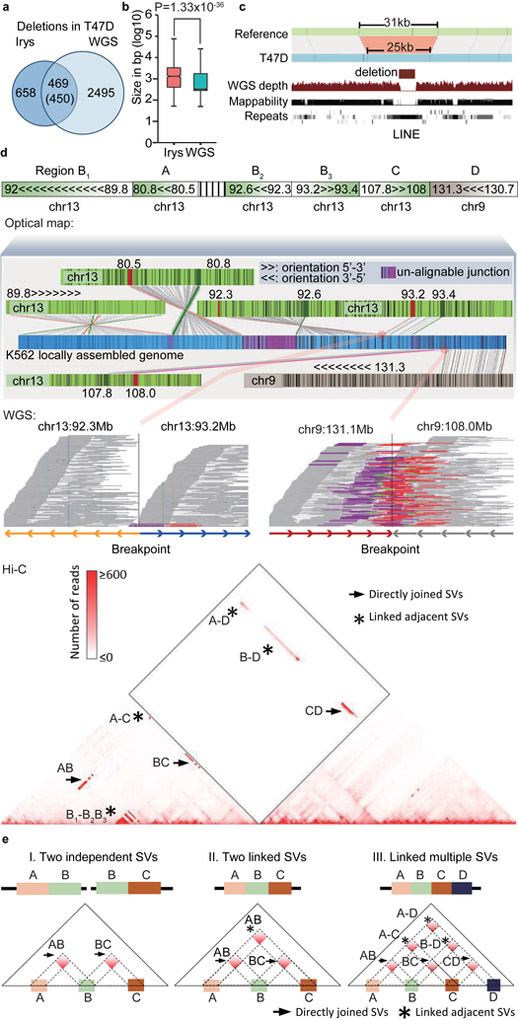
Figure 3 ∣. Comparison of SVs detected by different methods.
a. Overlap of deletions in T47D cells detected by optical mapping and WGS. b. Size distribution of deletions detected by optical mapping (n=1108) and WGS (n=2964, P = 1.33X10−36, two-sided Wilcoxon rank-sum test). For boxplots, the box represents the interquartile range (IQR), and the whiskers extend to 1.5 times the IQR or to the maximum/minimum if less than 1.5x IQR. c. Optical mapping detects a 6Kb deletion within chrX:96,041,289–96,072,340 that is missed by WGS. d. Reconstruction of the complex local structure of a derivative chromosome in K562 cells through integration of optical mapping, Hi-C and WGS. The rearranged allele consists of 5 regions: A (chr13:80.5–80.8Mb), B (chr13:89.7–93.3Mb), C (chr13:107.8–108Mb), D (chr9:130.7–131.3Mb), and an unalignable region. Further, segment B consists of three smaller regions (B1, B2, and B3 in the figure). We reconstructed a global view of the genome structures in this region by stitching several optical mapping contigs together (middle panel). Each junction of the optical mapping genome map can be validated by Hi-C data. WGS data can provide bp-resolution breakpoints for specific breakpoint junctions. Each line in the WGS panel represents a read pair. WGS reads that support the breakpoint site are marked as purple (forward strand) and red (reverse strand). e. Strategy of using Hi-C to reconstruct SVs. Hi-C shows increased interaction frequency if two translocated regions are directly joined (→) or if they are not immediately adjacent (*), but are linked to the same rearranged allele.

