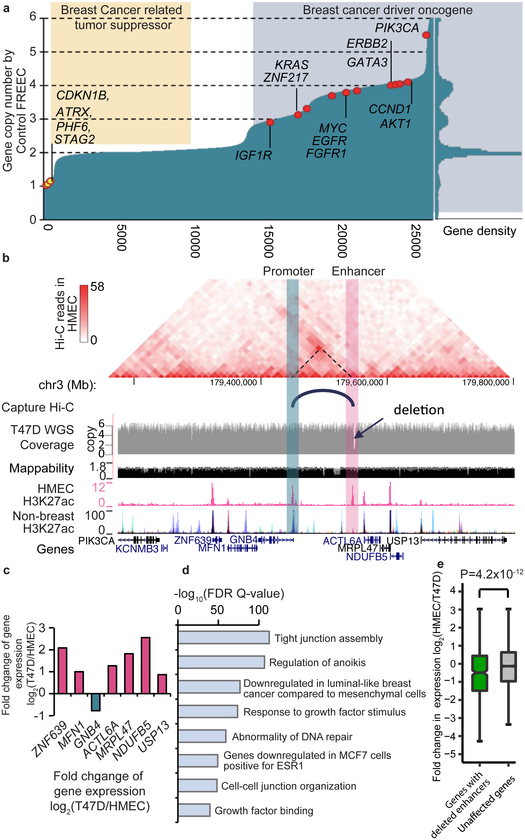
Figure 4 ∣. The impact of SVs on enhancers.
a. Copy number changes in T47D cells of Refseq genes, sorted by copy number. Genes that are frequently mutated in breast-cancer are labeled if they show amplification (red dots) or deletion (yellow dots). The right panel of this figure displays the density plot of gene copy numbers. b. A ~3.4kb deletion (chr3:179,546,826–179,550,207) in T47D overlaps an HMEC specific enhancer. Hi-C data from HMEC indicates that there is an interaction between the deleted enhancer and the promoter of gene GNB4. This enhancer-promoter linkage is also reported in GM12878 cells by the Capture Hi-C data. According to WGS data, the local region is amplified and has 6 copies in T47D cells, but the enhancer is deleted in 5 of the 6 copies. c. Compared with HMEC, all the genes in this region in T47D are up-regulated potentially due to the local amplification, except for GNB4, whose expression is reduced by ~50%. d. Functional pathway analysis of deleted enhancers (n=1859) by GREAT tool (P-value from two-sided Binomial test). e. Genes with deleted enhancers show reduced expression levels (two-sided Wilcoxon rank-sum test). Genes with exon deletions or copy number loss are excluded. 534 genes are linked by Capture Hi-C data to at least one deleted enhancer (green), and 10,677 genes are linked to enhancers that show no deletions (gray). For boxplots, the box represents the interquartile range (IQR), and the whiskers extend to 1.5 times the IQR or to the maximum/minimum if less than 1.5x IQR.

