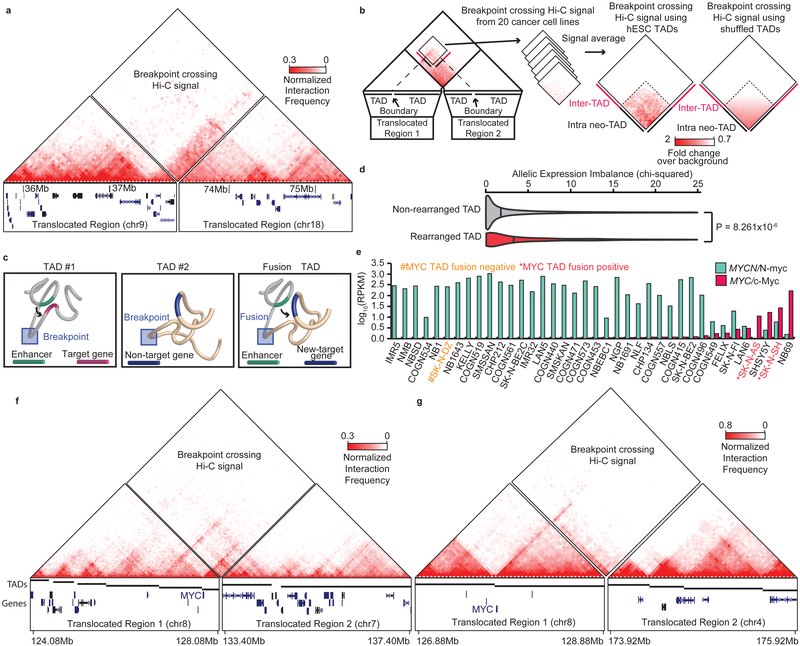
Figure 5 ∣. Rearrangements and TAD fusions.
a. Fusion TAD formation as a result of a translocation in Panc-1 cells. The left box shows the rearranged region on chromosome 9, while the right box shows the rearranged region on chromosome 18. The breakpoint fusion lies in the middle. Triangle Hi-C heat maps show intra-chromosomal interactions. The diamond heat map shows the breakpoint crossing Hi-C signal, indicating the presence of a TAD fusion. b. Aggregate analysis of TAD fusions. Breakpoint crossing Hi-C signals were averaged and centered on bins between the nearest TAD boundaries (left) or shuffled TAD boundaries (right - randomization performed 1000 times). Dashed lines show expected neo-TAD borders based on the intersections of the nearest breakpoint proximal TAD boundaries. c. Model for neo-TAD formation. TADs are rearranged due to breaks and fusions, juxtaposing regulatory sequences with non-target genes. d. Violin plots showing the distribution of allelic expression bias for genes within rearranged (n=1004) or non-rearranged (n=74184) TADs. Vertical bars represent the median (p-value is from two-sided Wilcoxon rank-sum test). e. RNA-seq for MYCN/N-Myc (green) and MYC/c-Myc in neuroblastoma cell lines. Cell lines with TAD fusions at the MYC locus show high levels of MYC expression (marked in red), and the cell line that lacks a TAD fusion at the MYC locus lacks MYC expression (yellow). f. Hi-C data from SK-N-SH cells showing a TAD fusion at the MYC locus. g. Hi-C data in SK-N-AS cells showing a TAD fusion at the MYC locus.

