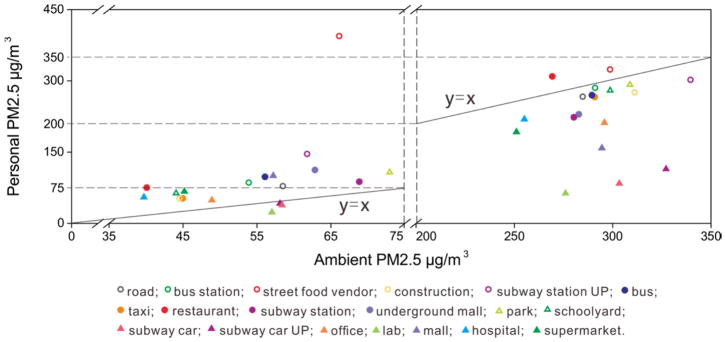
Fig. 4.
Comparison between personal exposure to PM2.5 and NMEMC monitored ambient PM2.5 concentration. a Solid and hollow dots represent enclosed and open MEs, respectively, while round and triangular dots represent source and receptor MEs, respectively. b The solid line is the 1:1 line. c Personal PM2.5 data of each ME is the average of all the minute data measured in that ME over all hazy or non-hazy days.

