Figure 2.

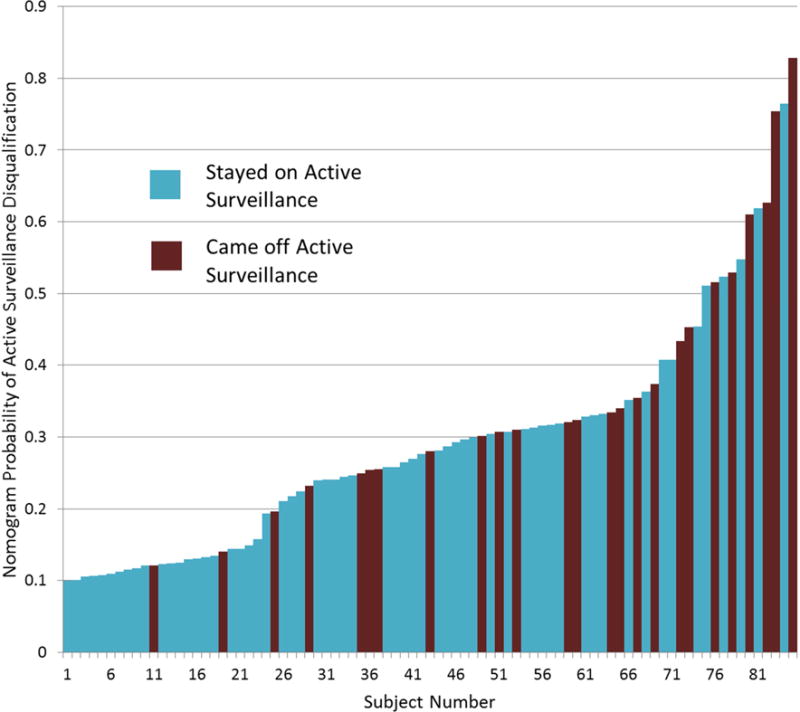
Waterfall plot of all patients with associated nomogram generated probability of disqualification from active surveillance on repeat biopsy color coded by actual biopsy result.

Waterfall plot of all patients with associated nomogram generated probability of disqualification from active surveillance on repeat biopsy color coded by actual biopsy result.