
Figure 3.
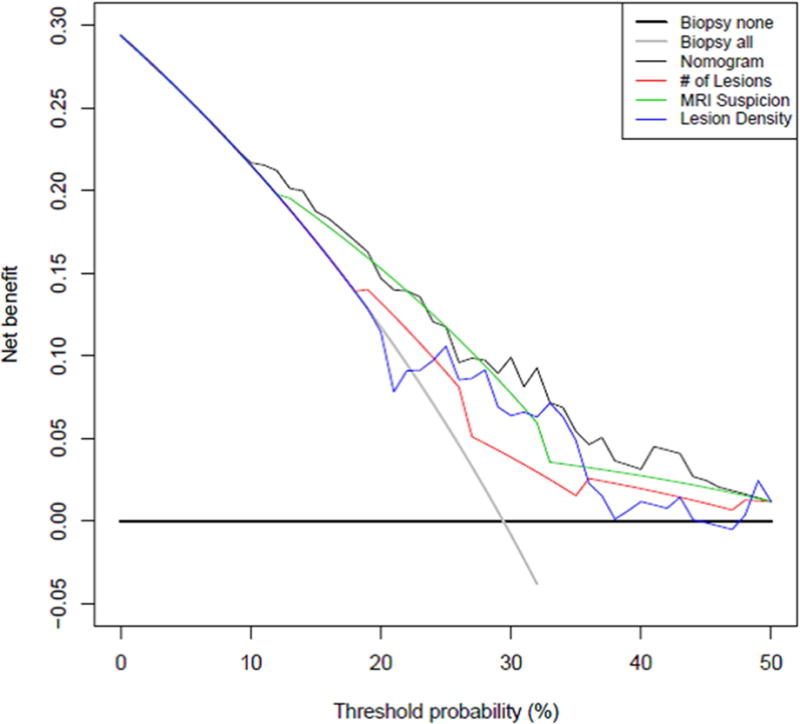
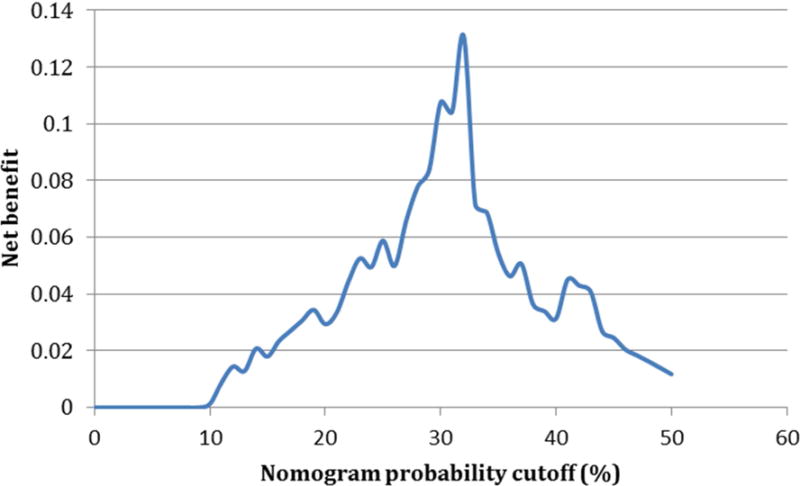
a: Decision curve analysis demonstrating net benefit of utilizing each nomogram component and the nomogram itself for determination of repeat biopsy on active surveillance patients Net benefit in this analysis was defined as the additional correct identification of an individual who is no longer a good candidate for AS. The curves show that the combination of all the factors leads to the most reliable identification of men who are not good candidates for continued AS. b: Additional net benefit at any given nomogram probability cutoff over the strategy of non-selective repeat biopsy on all men utilizing the nomogram to select patient for repeat biopsy. This figure shows that the ability of the nomogram to correctly identify men for AS increases until a certain threshold probability on the nomogram at which point it begins to decrease again.