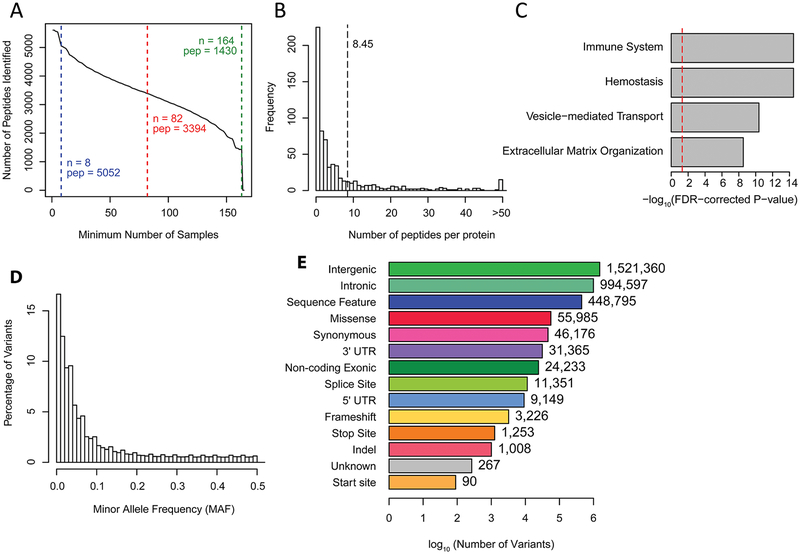
Figure 2.
Description of protein and genotype data: (A) Cumulative distribution plot showing the number of peptides identified in at least N samples. 5,052 peptides were identified in at least 8 samples (blue), 3,394 peptides were identified in at least 82 samples (red), and 1,430 peptides were identified in all 165 samples (green). (B) Histogram showing the number of peptides identified for each of the 664 parent proteins. A mean of 8.45 peptides per parent protein were identified (dotted line). (C) Bar plot showing q-values from Reactome pathway analysis of the significantly enriched top level groups in the Reactome event hierarchy. The significance threshold of −log10(0.05) is shown by the red dotted line. (D) Histogram of the minor allele frequencies in this study for all 3,148,863 genetic variants identified across individuals. (E) Bar plot of the number of identified genetic variants within each SnpEff annotation. The number of variants with each annotation is also listed next to each bar.

