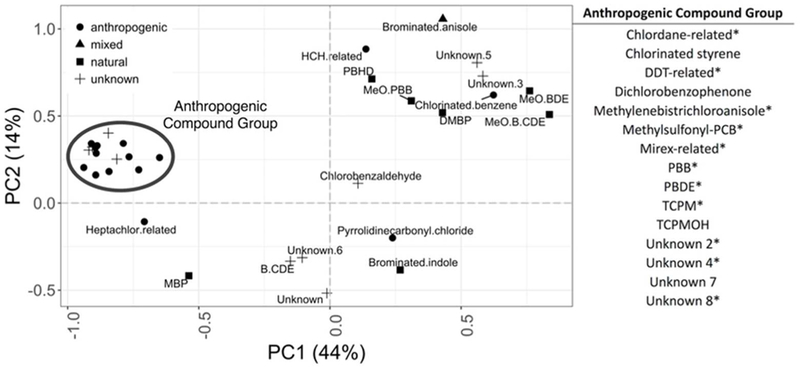
Figure 2:

A principal components analysis (PCA) plot of the loadings for all compound classes according to origin (anthropogenic, mixed, natural, or unknown). The drawn circle highlights the anthropogenic compound group and the compound classes contributing to this group are listed on the right. Within the group, compound classes with significant higher relative abundance according to the Random Forest are marked with an asterisk (*).
