
Figure 4:
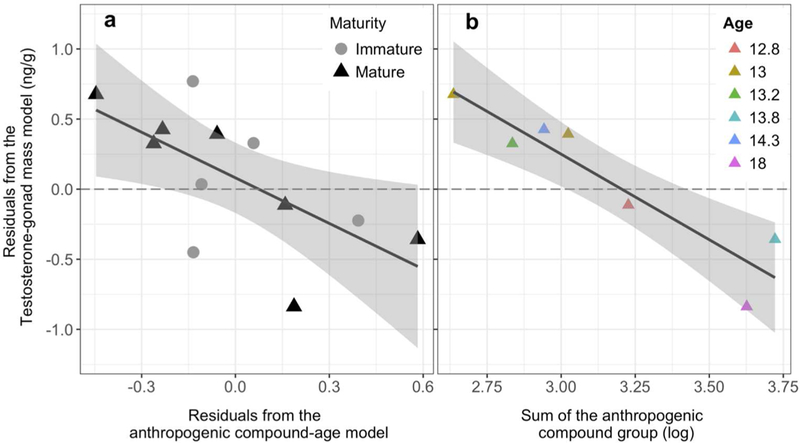
Regressions examining the relationship between the sum of the compound abundances in the anthropogenic contaminant group (AC group) compounds and blubber testosterone for age-corrected data combined (a) and the log-transformed mature-only, non-age-corrected contaminant sum (b). Black circles and triangles represent data from immature (I) and mature (M) animal samples, respectively) and color represents the age of mature individuals. Individuals below the dotted line have less testosterone than expected given the same gonad weight (and age for the age-corrected graph)