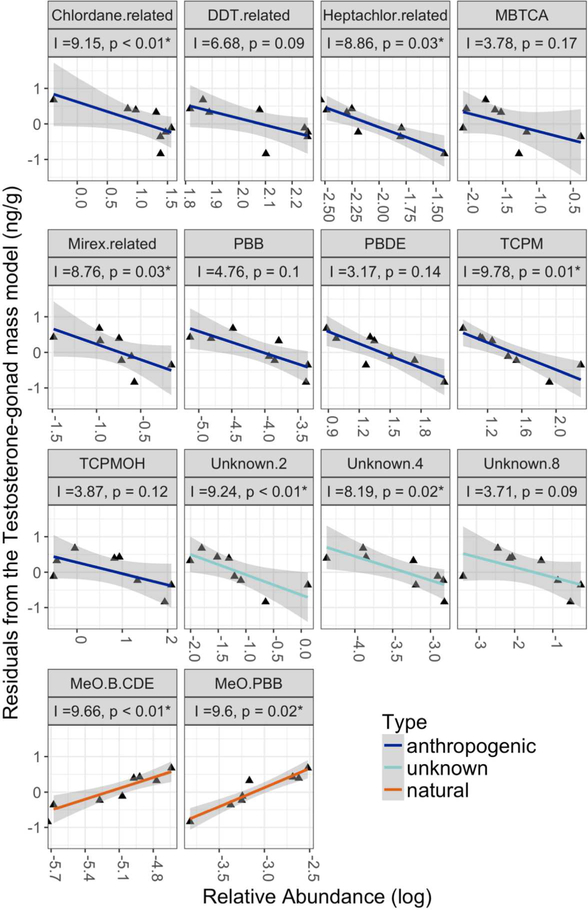
Figure 5:
The relative abundance of compound classes that increased predictive power of gonad weight adjusted testosterone concentration. Variable importance metrics (I) and p-values (p) are provided for each compound, where p-values below 0.05 were considered significant (*). Color denotes the origin of the compound (anthropogenic, unknown, or natural).

