FIGURE 3.

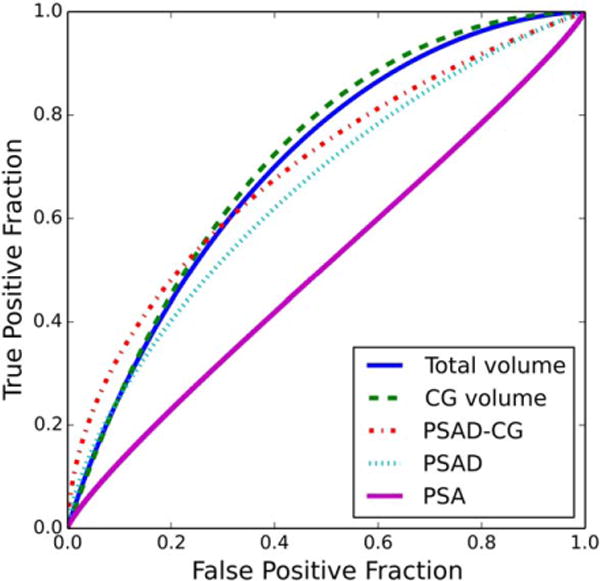
ROC curves for the total prostate volume, CG volume, CG-adjusted PSA density, PSA density, and PSA concentration in the classification of high-Gleason-sum PCa patients and non-PCa patients with elevated PSA level.

ROC curves for the total prostate volume, CG volume, CG-adjusted PSA density, PSA density, and PSA concentration in the classification of high-Gleason-sum PCa patients and non-PCa patients with elevated PSA level.