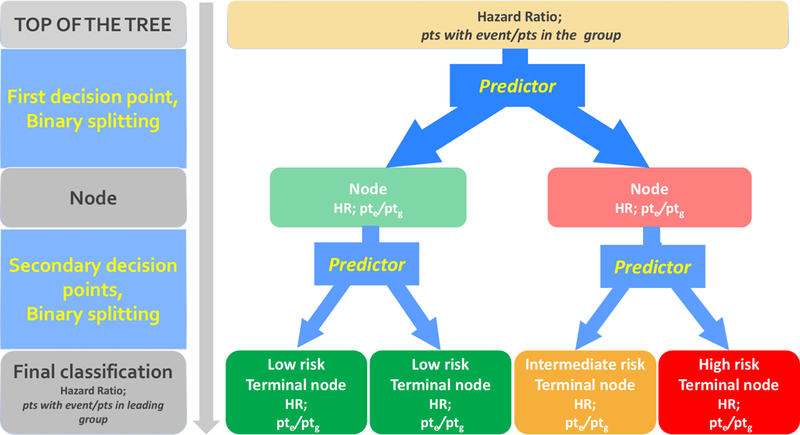
Figure 1.

Schema of the decision tree, consisting of nodes and leaves. The root note of the tree (shown on top) comprises all the patients; it splits into daughter nodes; the splitting process continues recursively for each subsequent node. Subsequent splitting allows for the identification of subgroups with homogeneous risk profile. At the top of the tree HR is 1, since the baseline hazard of the entire cohort of the study is used as reference. Each intermediate node and final leaf (lower boxes) indicates a class with a homogeneous risk profile: low-risk patients (HR<0.7) are in green boxes, medium-risk (0.7≤HR≤1.4) in yellow boxes, high-risk (HR>1.4) in red boxes. HR: Hazard Ratio for the patients in the group (leaf). Pte: number of patients with the event in the group. Ptg: total number of patients in the group.
