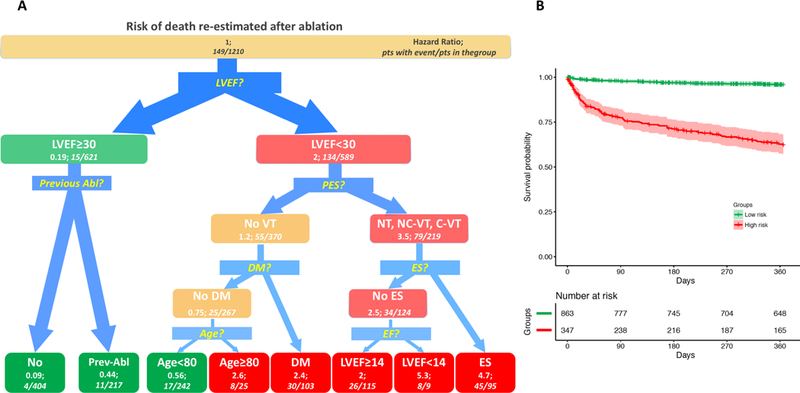
Figure 5.

Survival Tree for re-estimation of the mortality risk after the procedure and Kaplan-Meyer analysis in derived groups. A. Survival Tree. Left panel: The figure follows the schema of the Survival Tree with decisional points, nodes and final classification leafs shown in Figure 1. LVEF remains as the most predictive variable also for post-operative risk estimation. In patients with LVEF<30%, the result of programmed stimulation after the procedure (PES), Diabetes Mellitus (DM), ES (Electrical Storm), Age provided further risk stratification. In patients with LVEF≥30% occurrence of a previous ablation (Previous Abl) was identified as further splitting variable. No VT: absence of any VT inducible at programmed stimulation after the ablation; NC-VT: Non clinical ventricular tachycardia inducible after the ablation; C-VT: Clinical ventricular tachycardia inducible after the ablation; NT: not tested. B. Right panel: Kaplan-Meier estimates with 95% confidence intervals of VT recurrence for patients with low (green line), medium (yellow line) and high profile (red line).
