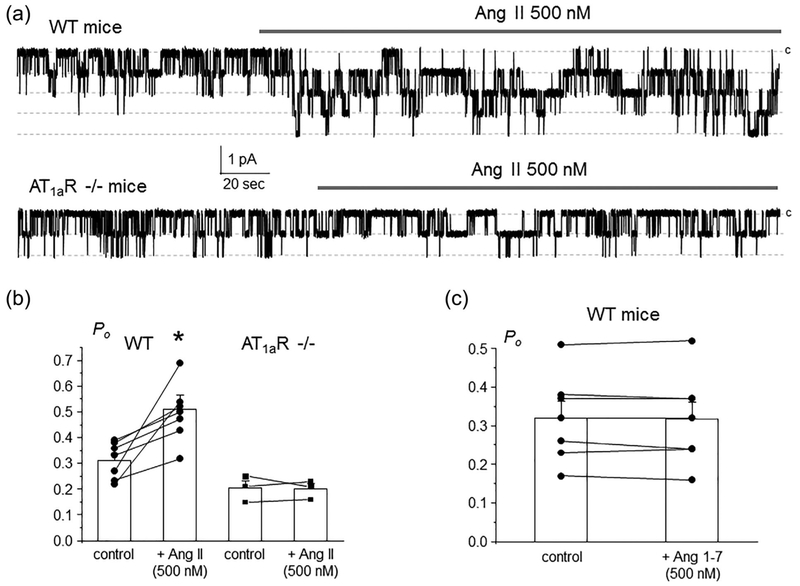
FIGURE 1.
AT1aRs are central for regulation of ENaC activity in the CD by Angiotensin II. (a) Representative continuous current traces from cell-attached patches monitoring ENaC activity in the control and during application of 500 nM Ang II (shown with a bar on the top) in a split-opened CD from WT (upper trace) and AT1aR −/− (bottom trace) mice. The patches were held at a test potential of Vh = − Vp = − 60 mV. Inward currents are downward. Dashed lines indicate the respective current state with a c denoting the closed state. (b) Summary graph of ENaC Po changes in response to Ang II from paired patch clamp experiments in WT and AT1aR −/− mice similar to that shown in Figure 1a.*significant increase versus WT control. (c) Summary graph of ENaC Po changes in response to stimulation of Mas receptors with 500 nM Ang 1–7 in split-opened CDs from Wild type mice

