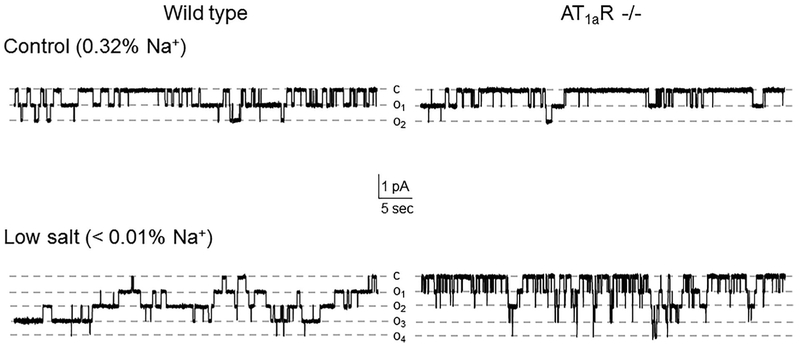
FIGURE 2.
ENaC activity is reduced in AT1aR −/− mice. Representative current traces of ENaC activity in split-opened CDs isolated from Wild type (left column) and AT1aR −/− (right column) mice kept on control (0.32% Na+, top row) and low (<0.01% Na+, bottom row) salt intake for 1 week. Dashed lines indicate the respective current state with oi indicating the number of simultaneously opened channels; c denotes the closed non-conducting state

