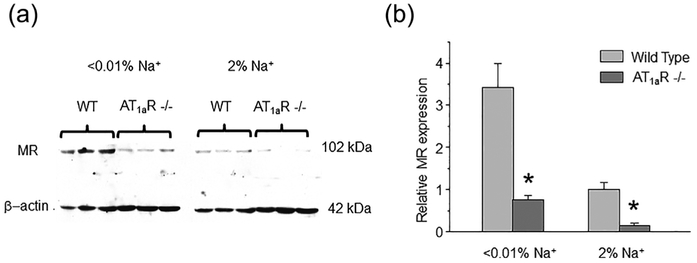
FIGURE 6.
Decreased MR availability in AT1aR −/− mice during different salt intake. (a) Representative Western blot from whole kidney lysates (cytosolic fraction) of WT and AT1aR −/− mice (each line reflects individual animal) kept on low (<0.01% Na+) and high (~2% Na+) salt intake for 1 week simultaneously probed with anti-MR and anti-β actin antibodies. (b) Summary graph comparing MR expression normalized to the respective intensity of β-actin in WT and AT1aR −/− mice on the same conditions as described in Figure 6a. *significant decrease versus respective Wild type values

