
Figure 3. DC-mediated IL-12 production requires IFN-γ sensing.
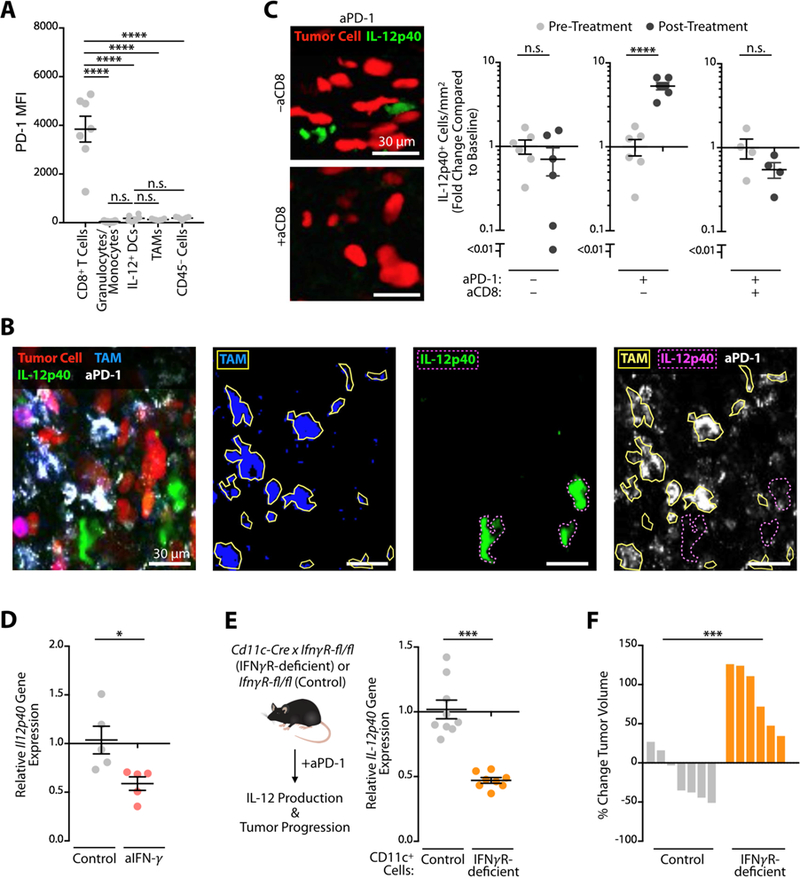
(A) Flow cytometry measurement of PD-1 expression across cell types in the MC38 tumor microenvironment. (B) Intravital micrographs of the MC38 tumor microenvironment in an IL12 reporter mouse five days after AF647-aPD-1 treatment. Tumor cells (red), TAM (blue), IL-12p40 (green), aPD-1 (white). (C) Intravital micrographs and quantification of IL-12p40 signal two days after aPD-1 treatment in the tumor microenvironment after CD8 depletion. Tumor cells (red), IL-12p40 (green). Data plotted as fold change in IL-12p40 from baseline levels. (D) MC38 tumors were harvested at 3 days post- treatment with aPD-1 in combination with aIFN-γ or control, and processed for RNA isolation. Quantitative PCR for IL12p40 gene expression data are normalized with control sample values set to 1. (E) Relative IL-12p40 gene expression in MC38 tumors from CD11c-cre (Itgax-cre) x IFNγ R1fl/fl (IFN.R-deficient) or control (IFNγ R1fl/fl) mice three days after aPD-1 treatment. (F) Change in MC38 tumor volume on day six after aPD-1 treatment in IFN. R-deficient or control mice. Data are relative to pre-treatment tumor volumes. Data are representative of at least two independent experiments. n.s. = not significant, * p < 0.05, ** p < 0.01, *** p < 0.001, **** p < 0.0001. For comparisons between two groups, Student’s two- tailed t-test was used. For comparisons between three or more groups, One way ANOVA with multiple comparisons was used. See also Figure S3.