
Figure 1. Evaluation of cardiomyocyte regeneration in neonatal porcine hearts.
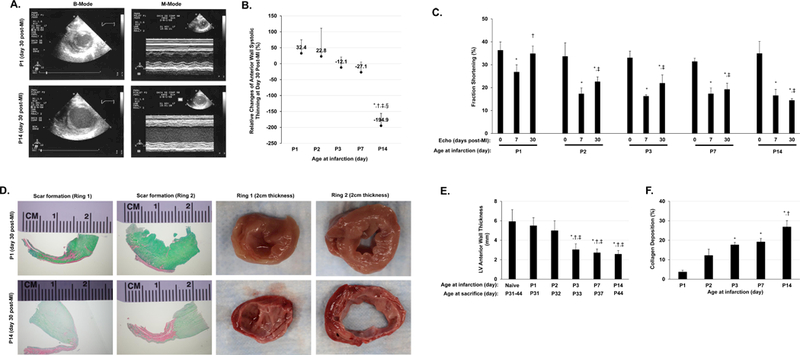
AMI was surgically induced in neonatal pigs on postnatal days 1, 2, 3, 7, and 14 (i.e., the P1, P2, P3, P7, and P14 groups, respectively). (A) B-Mode and M-Mode images were acquired via transthoracic echocardiography; representative images were displayed for animals in the P1 and P14 groups on day 30 after AMI induction. (B) Echocardiographic images of LV systolic thickening obtained before AMI induction and 30 days afterward were used to calculate the relative change in LV anterior wall systolic thickening/thining. *P<0.05 vs. P1, †P<0.05 vs. P2, ‡P<0.05 vs. P3, §P<0.05 vs. P7. One-way ANOVA with the Holm-Sidak method. n=3–4 animals in each group. (C) Fractional shortening was evaluated before and 30 days after AMI induction. *P<0.05 vs. Pre-AMI (day 0) for the same experimental group; †P<0.05 vs. P1 at day 7 post-AMI; ‡p<0.05 vs. P1 at day 30 post-AMI. Repeated measures two-way ANOVA. n=3–4 animals in each group. (D) LV heart sections from P1 and P14 animals were obtained on day 30 after AMI induction and stained with Sirius red and Fast-green to identify the scarred (red) and unscarred regions, respectively (left four panels) or observed macroscopically (right four panels) to evaluate wall thinning. LV anterior wall thickness (E) and Scar size (as indicated by % collagen deposition in F) were quantified. For (E): *P<0.05 vs. normal hearts of control animals; †p<0.05 vs. P1 AMI animals; ‡P<0.05 vs. P2 AMI animals; for (F): *P<0.05 vs. P1 AMI animals; †p<0.05 vs. P2 AMI animals; One-way ANOVA with the Holm-Sidak method. n=3–4 animals in each group.