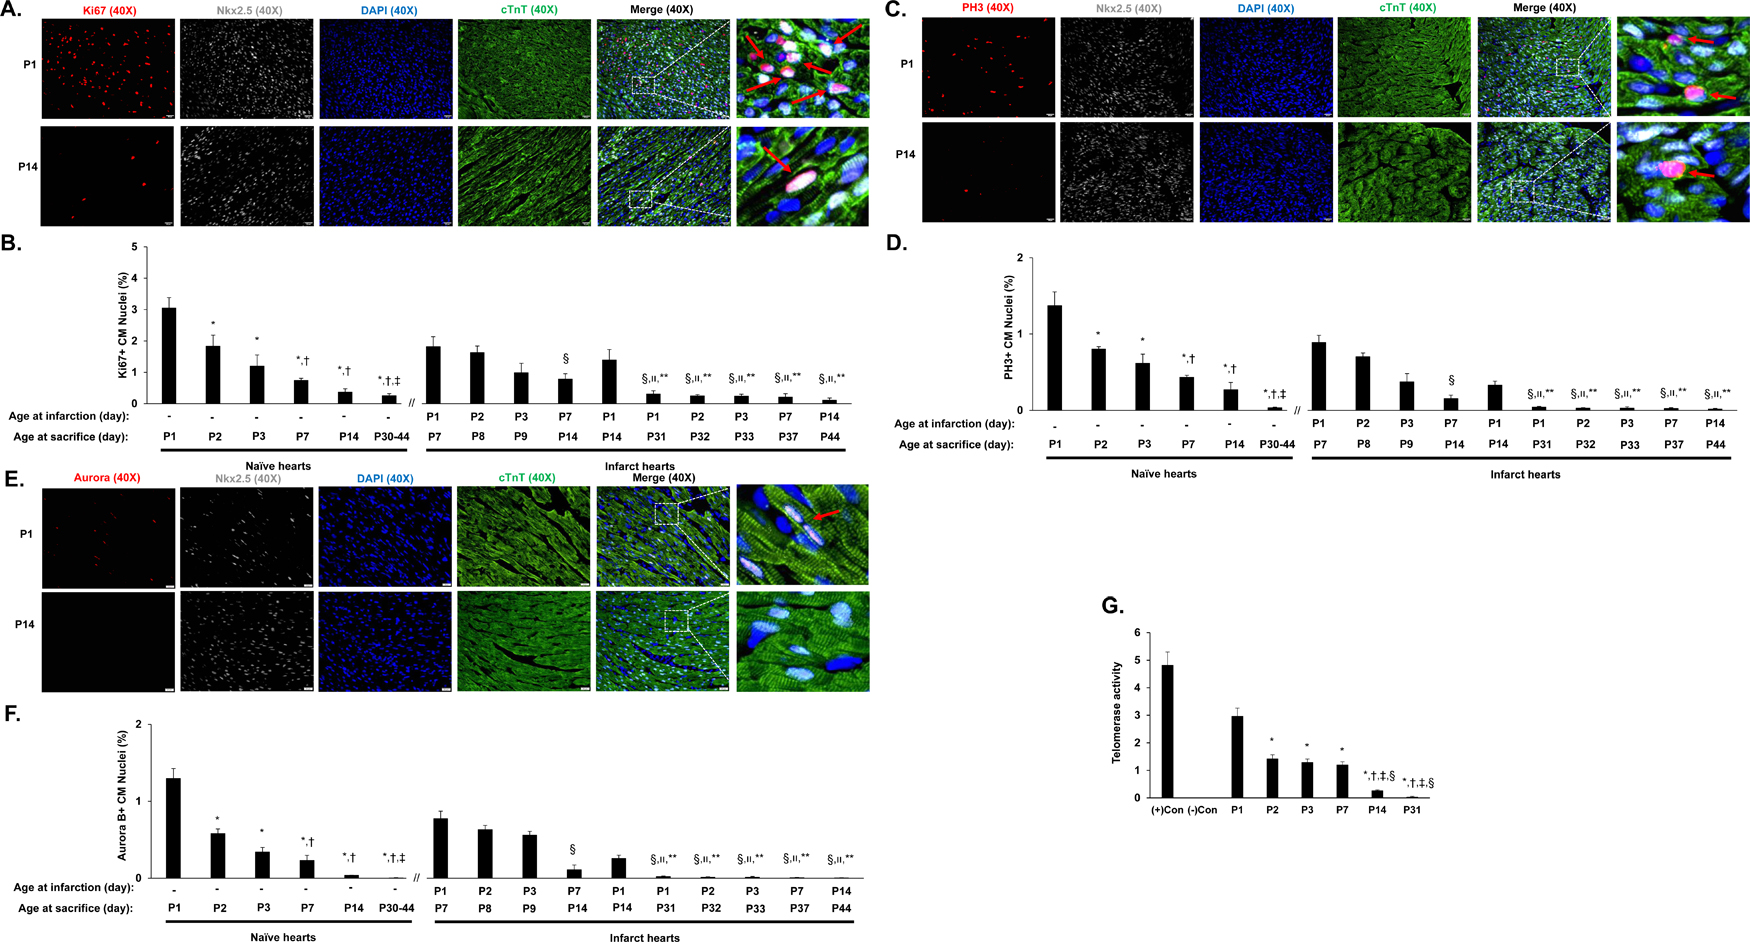
Figure 2. Characterization of cell cycle activity and proliferation in neonatal porcine hearts.
(A-F) The expression of proliferation (Ki67), mitosis (PH3), and cytokinesis (Aurora B) markers was evaluated via immunofluorescent staining in paraformaldehyde-fixed heart sections; cardiomyocytes were visualized by staining for cTnT, and nuclei were labeled with anti-Nkx2.5 antibodies and counter-stained with DAPI. Cardiomyocytes that stained positively for each marker (Ki67, PH3, or Aurora B) were counted, normalized to the total number of cardiomyocytes (Nkx2.5-cTnT double-positive cells) and expressed as a percentage. A total of 3 sections of border zone myocardium (12 images) were counted. (A) Representative images are displayed for sections used to evaluate Ki67 expression on in the normal hearts of P1 and P14 animals (Bar = 20 µm) (B) Cardiomyocyte proliferation was quantified at the indicated day of sacrifice in normal hearts and in the AMI hearts of P1, P2, P3, P7, and P14 animals as the proportion of Nkx2.5-cTnT double-positive cells that also expressed Ki67. The data for days P30-P44 were pooled. *P<0.05 vs. P1 normal hearts; †P<0.05 vs. P2 normal hearts; ‡P<0.05 vs. P3 normal hearts; §P<0.05 vs. P1 AMI hearts (harvested at P7); װP<0.05 vs. P2 AMI hearts (harvested at P8); **P<0.05 vs. P1 AMI hearts (harvested at P14). One-way ANOVA with the Holm-Sidak method. n=3–4 animals in each group. (C) Representative images are displayed for sections used to evaluate PH3 expression in the hearts of P1 and P14 normal animals (Bar = 20 µm). (D) Cardiomyocyte mitosis was quantified at the indicated day of sacrifice in normal hearts and in the AMI hearts of P1, P2, P3, P7, and P14 animals as the proportion of Nkx2.5-cTnT double-positive cells that also expressed PH3. The data for days P30-P44 were pooled. *P<0.05 vs. P1 normal hearts; †P<0.05 vs. P2 normal hearts; ‡P<0.05 vs. P3 normal hearts; §P<0.05 vs. P1 AMI hearts (harvested at P7); װP<0.05 vs. P2 AMI hearts (harvested at P8); **P<0.05 vs. P1 AMI hearts (harvested at P14). One-way ANOVA with the Holm-Sidak method. n=3–4 animals in each group. (E) Representative images are displayed for sections used to evaluate Aurora B expression in the hearts of P1 and P14 normal animals (Bar = 20 µm). (F) Cardiomyocyte cytokinesis was quantified at the indicated day of sacrifice in normal hearts and in the AMI hearts of P1, P2, P3, P7, and P14 animals as the proportion of Nkx2.5-cTnT double-positive cells that also expressed PH3. The data for days P30-P44 were pooled. *P<0.05 vs. P1 normal hearts; †P<0.05 vs. P2 normal hearts; ‡P<0.05 vs. P3 normal hearts; §P<0.05 vs. P1 AMI hearts (harvested at P7); װP<0.05 vs. P2 AMI hearts (harvested at P8); **P<0.05 vs. P1 AMI hearts (harvested at P14). One-way ANOVA with the Holm-Sidak method. n=3–4 animals in each group. (G) Telomerase activity was assessed in the myocardium of normal hearts on postnatal days 1, 2, 3, 7, 14, and 31 (P1, P2, P3, P7, P14, and P31, respectively). Control assessments were performed with (+) or without (−) telomerase which were included in the kit. *P<0.05 vs. P1; †P<0.05 vs. P2; ‡P<0.05 vs. P3; §P<0.05 vs. P7. One-way ANOVA with the Holm-Sidak method. Experiments were repeated twice (n=3).

