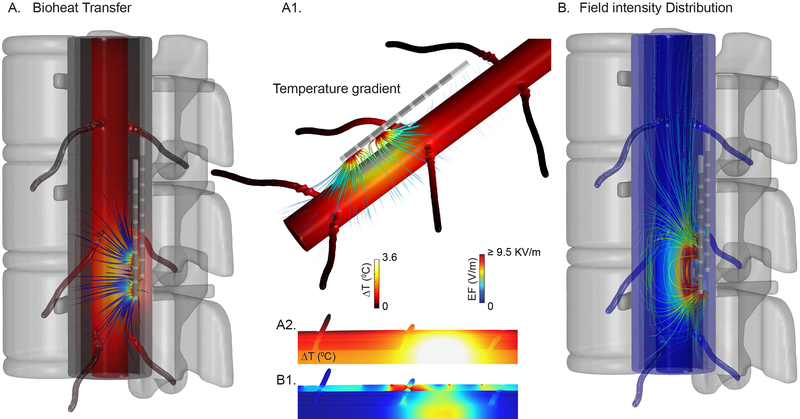
Fig 3: FEM Bioheat transfer model of Spinal Cord Stimulation predicts temperature changes and electric field intensities.
(A) Temperature increases at the spinal cord modelled with dorsal roots, and surrounding tissues for a metabolic heat and blood perfusion modulated high rate spinal cord stimulation (KHZ-SCS). Temperature gradient streamlines originated from SCS leads to the spinal cord and dorsal roots are depicted. (A1) Accumulated heat (shown as heat flux streamlines) transported throughout spinal cord and dorsal roots during kHz-SCS. (A2, B2) illustrates predicted temperature and electric field (EF) spatial distribution on a spinal cord, dorsal roots, and other adjacent tissues. (B) Field intensity distribution across spinal cord and surrounding tissues. EF strength across each tissue are depicted by electric field streamlines seeded on every tissue boundary.

