
Figure 3. Regulatory T cell IL-10 expression during inflammation.
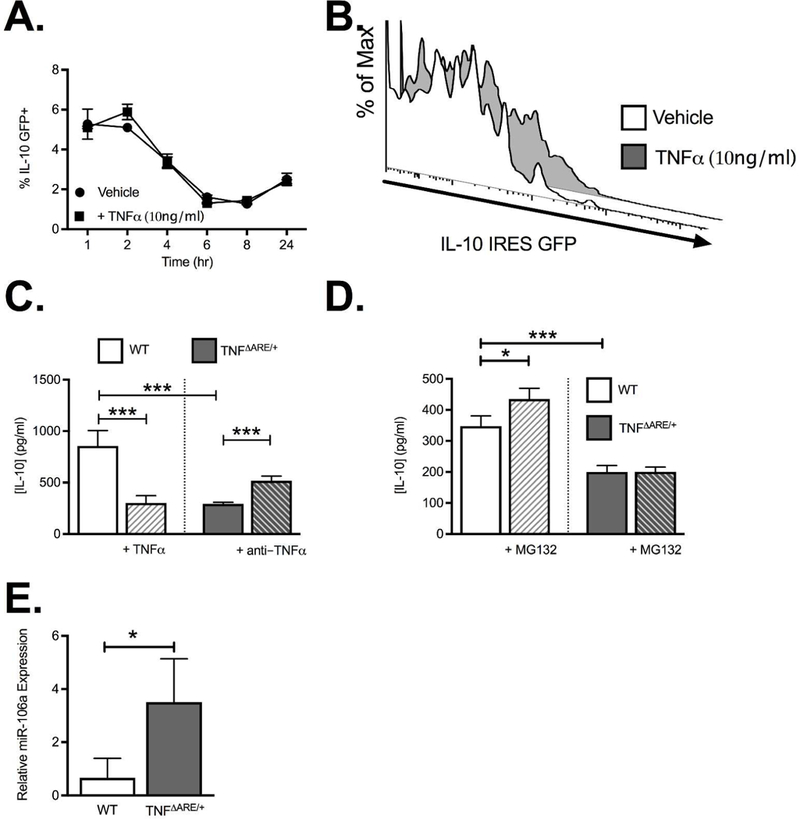
(A) Flow cytometric analysis of IL-10 mRNA in Tregs from IL-10 IRES-GFP reporter mice treated +/− TNFα (10ng/ml) demonstrates no significant difference in IL-10 mRNA transcription. (B) Representative histogram showing the GFP-positive IL-10 reporter cells. (C) ELISA quantification of IL-10 production following 24 h treatment with anti-CD3/CD28 stimulation of isolated CD4+CD25+ Tregs from WT and TNFΔARE/+ mice treated in vitro with either TNFα (10ng/ml) or anti-TNFα antibody (10μg/ml; CNTO5048). (D) ELISA quantification of IL-10 production following 24 h treatment with MG132 (1μM) demonstrated that the decreased IL-10 production seen in CD4+CD25+ Tregs from TNFΔARE/+ mice was not restored by inhibition of proteasomal degradation. (E) Real-time PCR validation of miR-106a expression by isolated CD4+CD25+ Tregs from WT and TNFΔARE/+ mice. Results represent mean ± SEM for three mice per group from three independent studies. *P<0.05, ***P<0.001.