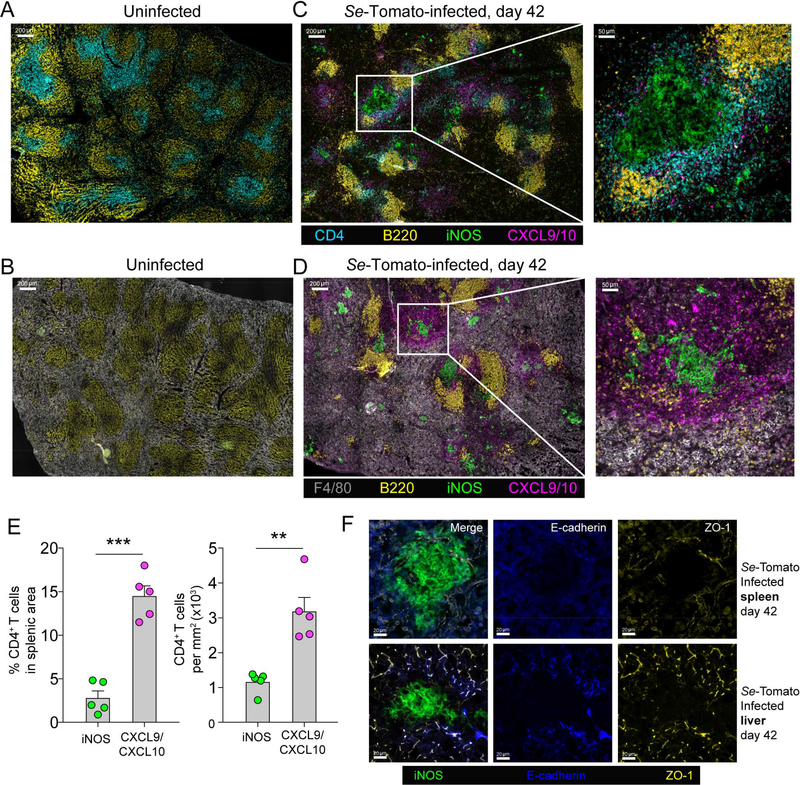
Figure 3. Se infection stimulates the development of iNOS+ granulomas bordered by CXCL9/10+ mononuclear phagocytes and CD4+ T cells.
(A, B) Spleen sections from an uninfected 129 mouse stained with the indicated antibodies, imaged at 200x magnification, and tiled to cover the entire section. (C, D) Spleen sections from a day 42 Se-Tomato-infected 129 mouse stained with the indicated antibodies, imaged at 200x magnification, and tiled to cover the entire section. Parts of the images in C and D in white boxes are shown enlarged. (E) Mean percentages (± S.E.M.) of total CD4+ T cells in CXCL9/10+ or iNOS+ areas of the spleen images represented in (C), and mean density (± S.E.M.) of CD4+ T cells (per mm2) calculated from dividing the number of CD4+ T cells within each area by the total area of each region. The positions of CD4+ T cells were determined by histo-cytometry and CXCL9/10+ or iNOS+ clusters by a DBSCAN-based algorithm. Images from five individual mice were analyzed. The paired student’s T-test was used to compare the percentage (left) and density (right) of CD4+ T cells within different anatomical locations (** p = 0.007, *** p = 0.0005). (F) Images of spleen (top row) or liver sections (bottom row) from day 42 Se-Tomato infected mice (left column) stained with the indicated antibodies.

