
Fig. 3.
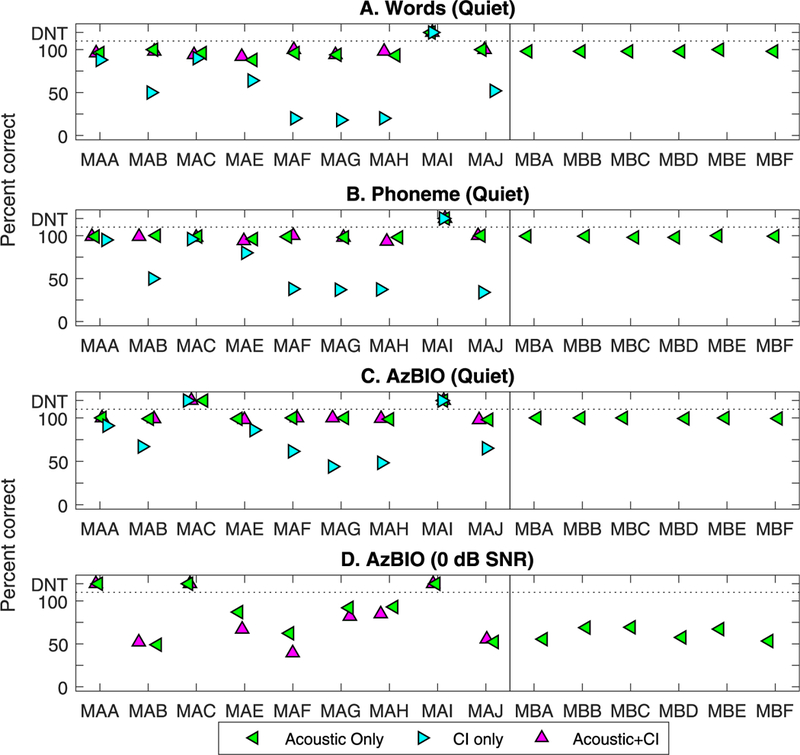
Percent correct scores from the CNC words testing, including words (top) and phonemes (bottom), comparing Acoustic, cochlear implant (CI) and Acoustic + CI. Along the xaxis are individual subjects, with the single-sided deafness and a CI (SSD-CI) subjects on the left and SSD subjects on the right, hence only the Acoustic data point for the latter. Results are shown for CNC words (panel A), phonemes (panel B), AZBio in quiet (panel C), and AzBio in noise (panel D). Percent correct scores shown in different symbols are compared in three conditions: Acoustic, Acoustic + CI, and CI.